Animated Remainder Graph


Requires a Wolfram Notebook System
Interact on desktop, mobile and cloud with the free Wolfram Player or other Wolfram Language products.
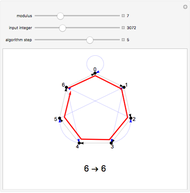
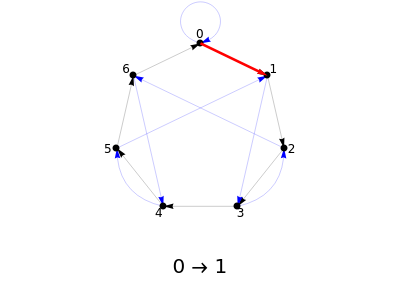
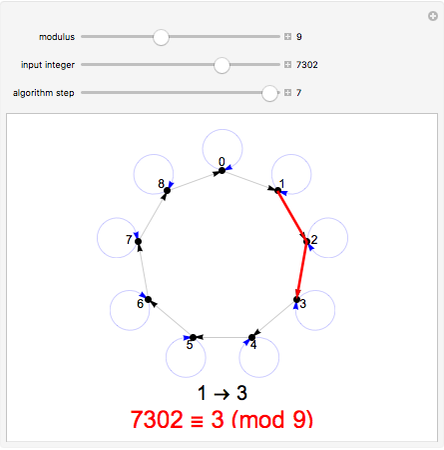
A remainder graph provides a visual way to calculate the remainder  upon dividing a given integer
  by a given modulus
  . To find the value of the remainder, take a walk on the graph starting at the 0 node. Read off the digits of from left to right. For each digit, walk the same number of steps along the black arrows, followed by a single step along a blue arrow. Continue until you follow the black arrows for the final digit. The node you end up at is the value of .
Contributed by: Adam Rumpf (October 2017)
Open content licensed under CC BY-NC-SA
Snapshots


Details
Given a modulus , the remainder graph has node set 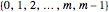 and two distinct sets of arcs. The black set forms the cycle
  . The blue set leads from each node
  to the node
  .
.
The purpose of the blue arcs is to give a quick shortcut for digits appearing before the final digit. For example, suppose you wish to use a remainder graph to calculate  . You could simply follow the black arrows for 53 steps to arrive at the correct answer, but the blue arrows let you skip some of those steps. By following the black arrows for five steps and then the blue arrow, you can immediately jump to the result of following the black arrows for 50 steps, after which you need only follow the black arrows for the remaining three steps.
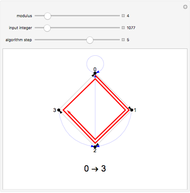
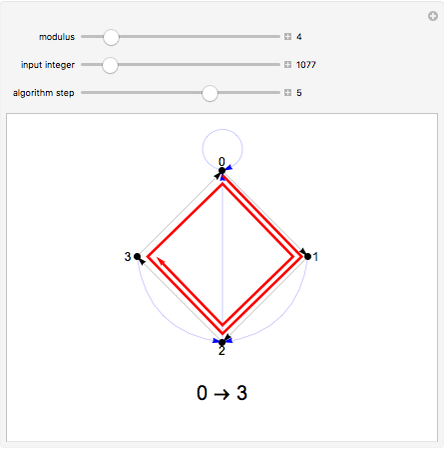
The remainder graphs for certain choices of modulus also help to give a visual illustration of common divisibility tests that math students are often told to memorize. For example, for modulus 2, 5 or 10, all blue arrows point to node 0. This has the effect of causing the walk to always begin at 0 for each new digit, which means that only the final digit matters when evaluating divisibility by 2, 5 or 10.
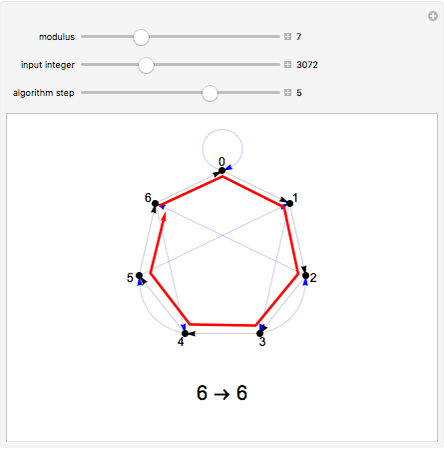
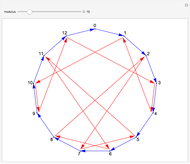
Likewise, for modulus 3 or 9, all blue arrows form a loop that points from each node to itself. This has the effect that the blue arrows can be ignored during the walk, in which case the total distance covered on the black arrows is simply the sum of all digits. If that sum is divisible by 3 or 9, respectively, then so is the input number.
References
[1] P. Talwalkar, "Divisibility by 7 Test Using a Graph. Why Does It Work? Sunday Puzzle," Mind Your Decisions (blog). (Oct 11, 2017) mindyourdecisions.com/blog/2015/07/26/divisibility-by-7-test-using-a-graph-why-does-it-work-sunday-puzzle.
[2] D. Wilson, "Divisibility by 7 Is a Walk on a Graph," Tanya Khovanova's Math Blog (blog). (Oct 11, 2017) blog.tanyakhovanova.com/2009/08/divisibility-by-7-is-a-walk-on-a-graph-by-david-wilson.
[3] D. Wilson, "Divisibility by 7 Is a Walk on a Graph. II," Tanya Khovanova's Math Blog (blog). (Oct 11, 2017) blog.tanyakhovanova.com/2010/08/divisibility-by-7-is-a-walk-on-a-graph-ii-2.
Permanent Citation
 Remainder Graphs
Ed Pegg Jr Solving Decanting Problems by Graph Theory
Stan Wagon A Graph Theory Interpretation of the Sum of the First n Integers
Aaron Dunigan AtLee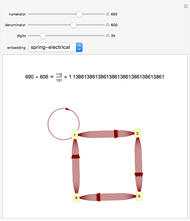 Graphs of the Successive Digits of Rational Numbers
Daniel de Souza Carvalho Fractional Graphs and Flowers
Kenneth E. Caviness and R. Lewis Caviness Beraha's Conjecture, Wheels, and Cyclic Graphs
Jacqueline Zizi Coloring Cycle Decompositions in Complete Graphs on a Prime Number of Vertices
Michael Morrison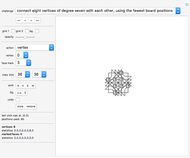 Graph Puzzles
Karl Scherer Graph for Six Degrees of Kevin Bacon
Arnab Kar and S.G. Rajeev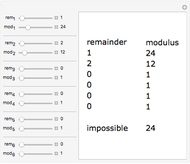 Chinese Remainder Theorem
Ed Pegg Jr