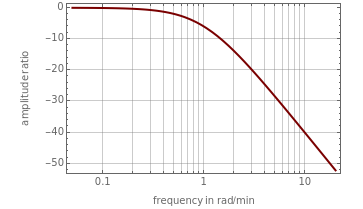
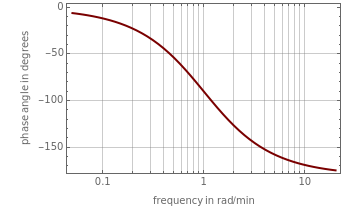
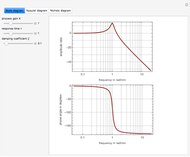
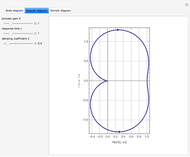
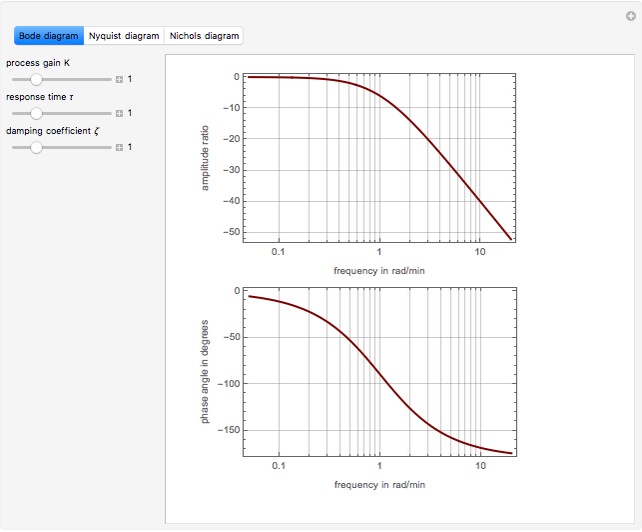
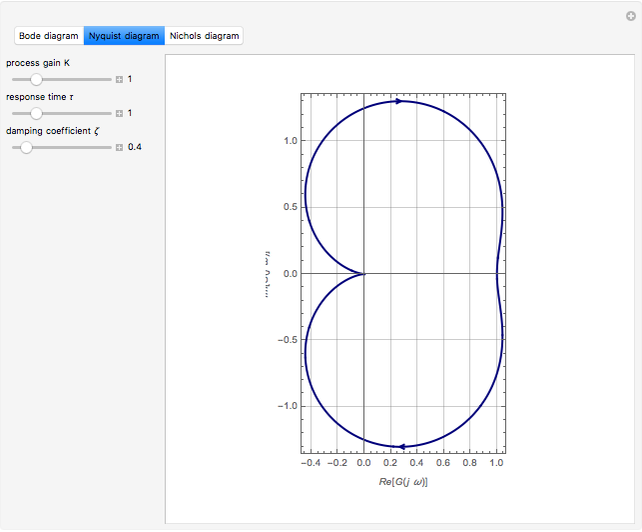
Bode, Nyquist, and Nichols Diagrams of Second-Order Systems
Initializing live version


Requires a Wolfram Notebook System
Interact on desktop, mobile and cloud with the free Wolfram Player or other Wolfram Language products.
Consider a second-order system given by the transfer function:
[more]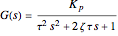


Contributed by: Housam Binousand Naim Faqir (March 2011)
(King Fahd University of Petroleum & Minerals)
Open content licensed under CC BY-NC-SA
Snapshots


Details
Reference
[1] D. E. Seborg, T. F. Edgar, D. A. Mellichamp, and F. J. Doyle III, Process Dynamics and Control, 3rd ed., New York: John Wiley & Sons, 2010.
Permanent Citation
Related Demonstrations
More by Author
 Phasor and Temporal Diagrams in Electrical Power-System Fault Analysis
Daniel Motter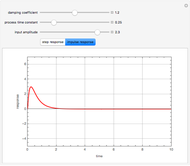 Step and Impulse Response of a Second-Order System
Housam Binous and Ahmed Bellagi Simplest Chaotic Circuit
Bharathwaj Muthuswamy RLC Tank Circuit Bandpass Filter: Triangle Waveform Input
Michael R. Braunstein Phasor Model for RC Filter Electronic Circuit
Michael R. Braunstein (Central Washington University) Bifurcation Diagram for the Rössler Attractor
Housam Binous Bifurcation Diagram for the Three-Variable Autocatalator
Housam Binous, Zakia Nasri, and Brian G. Higgins Bifurcation Diagram for the Gauss Map
Housam Binous Memristor Based Chaotic System
Bharathwaj Muthuswamy (University of California, Berkeley; Milwaukee School of Engineering)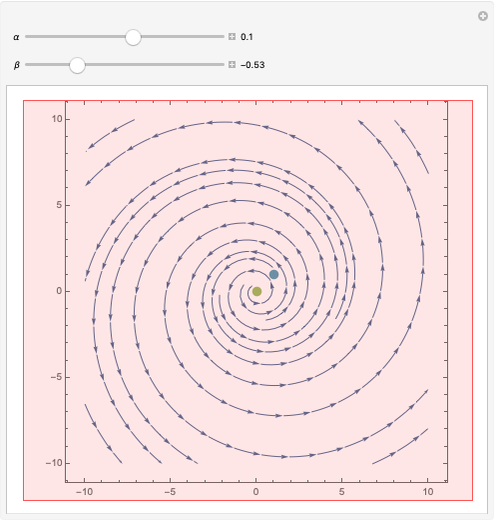 Dynamic Behavior of a Simple Canonical System
Housam Binous
-
 Distillation of a Ternary Ideal Mixture
Naim Faqir -
 Distillation Column Calculation Incorporating Pressure Drop Effect
Naim Faqir -
 Impulse Response of Two and Three Continuous Stirred-Tank Reactors in Series: Exact and Approximate Solutions
Naim Faqir -
 Analysis of an Extractive Distillation Column with Three Design Variables
Naim Faqir -
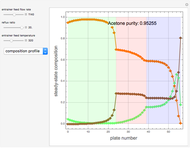
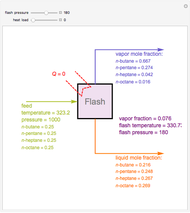 Flash Distillation of a Mixture of Four Hydrocarbons
Naim Faqir -
 Operation of a Depropanizer
Naim Faqir -
 Operation of a Debutanizer
Naim Faqir -
 Extractive Distillation of an Azeotropic Mixture of Isopropyl Alcohol and Water: Effect of Entrainer Feed Temperature
Naim Faqir -
 Multicomponent Distillation Column with a Sidestream
Naim Faqir -
 Entrainer Selection for Homogeneous Azeotropic Distillation
Naim Faqir -
 Steady-State Distillation of a Quaternary Mixture
Naim Faqir -
 Breaking the Acetone-Methanol Azeotrope with Different Extraction Solvents
Naim Faqir -
 Volatility Inversion in Extractive Distillation
Naim Faqir -
 Extractive Distillation of an Equimolar Acetone-Methanol Mixture Using Water
Naim Faqir -
 Steady State of an Extractive Distillation Column
Naim Faqir -
 Separating a Ternary Mixture of Water, 2-Propanol, and Acetone at Atmospheric Pressure
Naim Faqir -
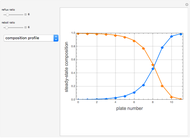 Steady-State Distillation of a Methanol-Water Mixture
Naim Faqir -
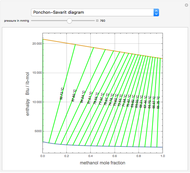 Ponchon-Savarit Diagram for Methanol-Water Mixture
Naim Faqir -
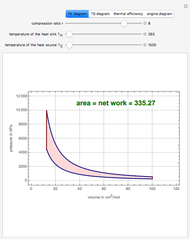 Otto Cycle
Naim Faqir -
 Bode, Nyquist, and Nichols Diagrams of Second-Order Systems
Naim Faqir