Body Mass and Onset of Hypothermia

Requires a Wolfram Notebook System
Interact on desktop, mobile and cloud with the free Wolfram Player or other Wolfram Language products.
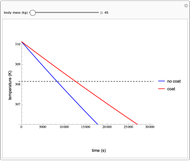
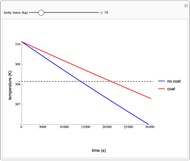
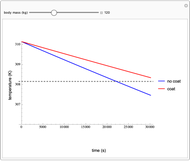
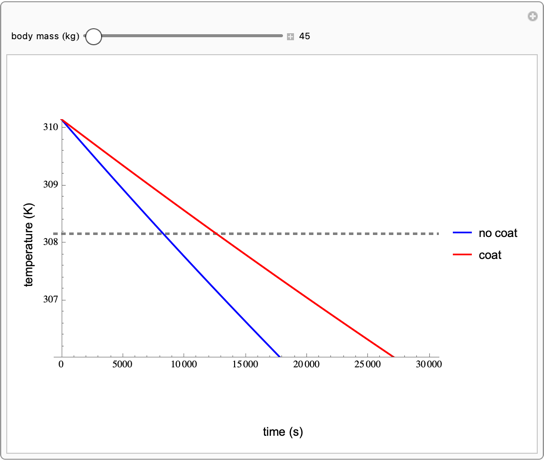
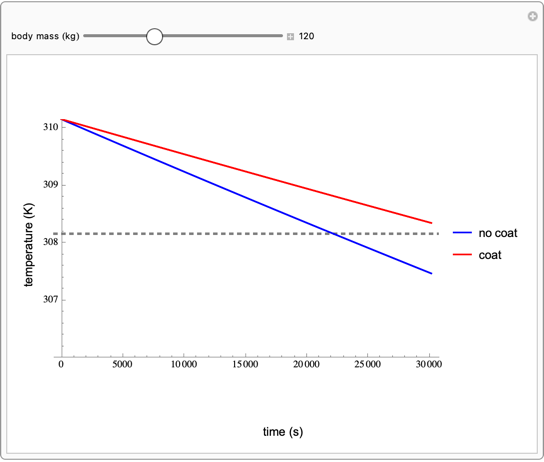
This Demonstration shows how the temperature of a person with or without a wool jacket changes as a function of time in a 273 K (0 °C) environment. Since the person is warmer than the air, they become colder as heat flows into the surrounding environment. The person's temperature versus time is plotted. The ability to retain heat is enhanced by higher body mass. Use the slider to set the body mass. As shown, a person's risk of hypothermia is reduced by wearing a jacket.
Contributed by: Alex Reed, Lauren Scolari and Jessica Suan (May 8)
Open content licensed under CC BY-NC-SA
Details
According to the CDC, there are approximately 1,300 deaths per year due to prolonged exposure to the natural cold [1]. Hypothermic body temperatures occur at or below 95 °F (approximately 308 K), shown as a dashed line [2]. We based our Demonstration on this value, determining how long it takes for the human body to reach this dangerous temperature either with or without a coat.
For realism, we assume some reasonable values of the relevant parameters:
1. an external temperature 273K (0 °C)
2. an average body temperature of 310.15 K (37 °C)
3. the mass of a wool coat to be 0.746 kg [3]
4. the mass of the subject ranges from 45 kg to 265 kg
5. the surface mass of a person is  [4]
[4]
6. the specific heat capacity of a human body is 3470 J/K [5],
7. the specific heat capacity of a wool coat is 1720 J/K [6]
8. the thermal conductivity of air is 0.026 J/s m K [4].
The following equation was used:
 .
.
We display a plot of temperature (K) as a function of time (s), with a horizontal line at  , indicating the time at which the subject would be deemed hypothermic. There are two different environments that were evaluated in this graph: a person wearing a wool coat, represented by the red line, and a person without a coat, represented by the blue dashed line. To create these lines, the temperature of the person was calculated each second, taking into account the heat flow from the person to the surrounding environment. The temperature values were collected in lists for each situation and then plotted as lines. The point at which each of these lines intersects the horizontal line indicates hypothetical onset of hypothermia.
References
[1] J. Xu. QuickStats: Number of Hypothermia-Related Deaths,* By Sex – National Vital Statistics System, United States, 1999–2011. CDC (Apr 5, 2023) www.cdc.gov/mmwr/preview/mmwrhtml/mm6151a6.htm.
[2] J. Borke. Hypothermia. Penn Medicine, (Apr 5, 2023) www.pennmedicine.org/for-patients-and-visitors/patient-information/conditions-treated-a-to-z/hypothermia#:~:text=Definition.
[3] The Fabric Weight Guide: Materials, Calculation. Hero and Villain Style. (Apr 5, 2023) heroandvillainstyle.com/fabric-weight.
[4] R. Nave, Conduction and Convection: Cooling Mechanisms for Human Body. http://hyperphysics.phy-astr.gsu.edu/hbase/thermo/bodcon.html.
[5] Human Body—Specific Heat. Engineering Toolbox. (Apr 5, 2023) www.engineeringtoolbox.com/human-body-specific-heat-d_393.html.
[6] Specific Heat of Substances Chart. AmesWeb. (Apr 5, 2023) amesweb.info/Materials/Specific_Heat_of _Substances.aspx.
Snapshots

Permanent Citation
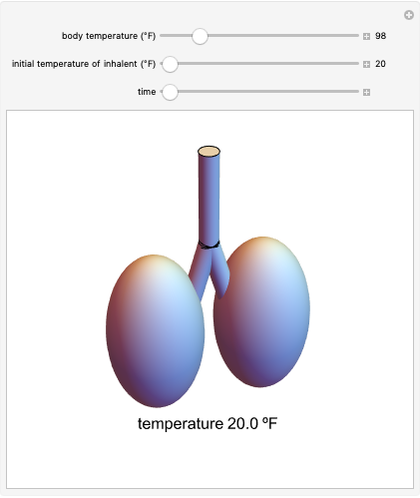 Temperature Changes for Inhalant Gases
Katherine Meade, Jessica Patalino and Rebecca Tran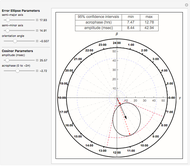 Cosinor Analysis Using Rotating Ellipse Tangents and Circle Collisions
Erik Mahieu and Forrester A. Lee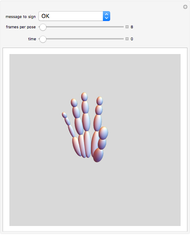 Fingerspelling Sign Language Using a Hand Model
Stewart Dickson and Shawna Martell Negligible Senescence Scenario
Michael Schreiber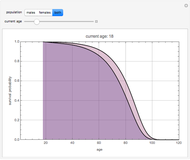 Life Expectancy in the U.S. Population
Jean Buck and Mike Pilat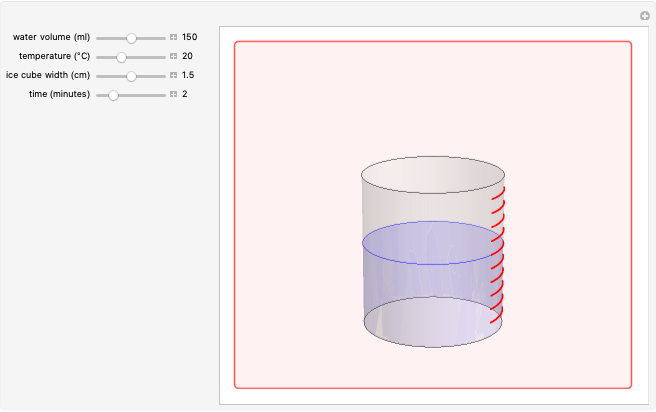 Ice Cube Melting in Water
S. M. Blinder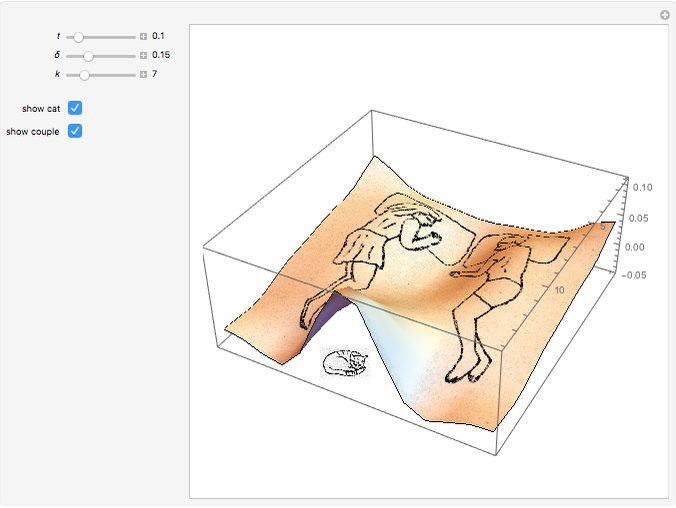 Solution of the Heat Equation for a Couple in Bed with a Cat
Enrique Zeleny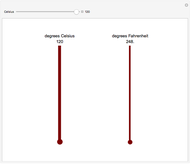 Celsius and Fahrenheit Thermometers
Sarah Lichtblau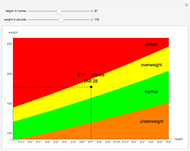 Body-Mass Index
Helmut Knaust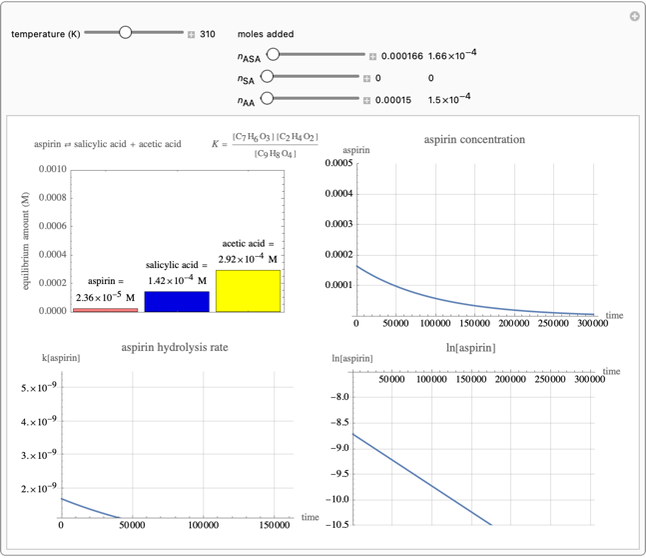 Aspirin Metabolism in the Body
Matthew Yacoub, Jihyun Park and Kevin Hsieh
