Cellular Automaton Media Strategy


Requires a Wolfram Notebook System
Interact on desktop, mobile and cloud with the free Wolfram Player or other Wolfram Language products.
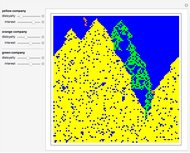
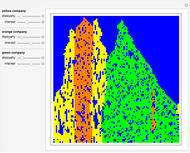
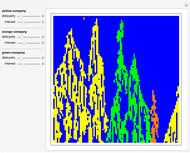
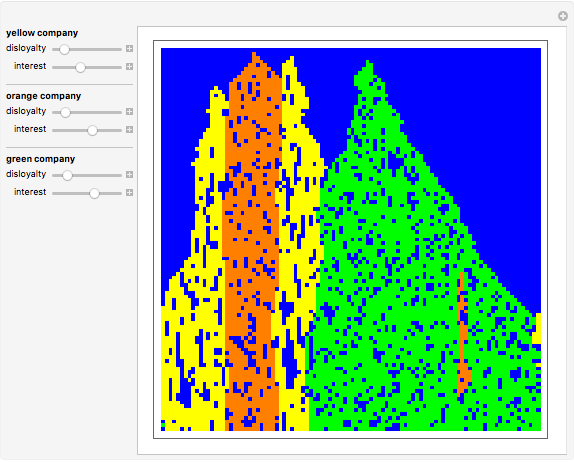
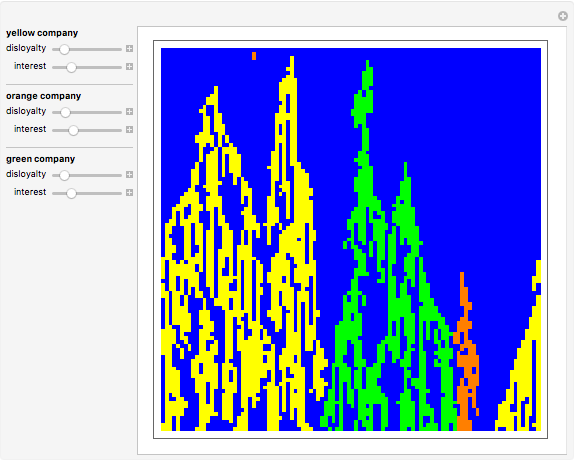
Three different companies (yellow, orange, and green) in the same market are competitors.
[more]
Contributed by: Anahit Manasyan (March 2011)
Open content licensed under CC BY-NC-SA
Snapshots


Details
This Demonstration was created during the New Kind of Science Summer School 2008 (NKS|Online) in Burlington, Vermont.
Permanent Citation
"Cellular Automaton Media Strategy"
http://demonstrations.wolfram.com/CellularAutomatonMediaStrategy/
Wolfram Demonstrations Project
Published: March 7 2011
 Cellular Automaton Fluids
Enrique Zeleny Cellular Automaton Browser
Jim Gerdy Cellular Automaton Compressibility
Hector Zenil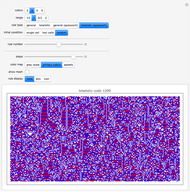 Cellular Automaton Explorer
Stephen Wolfram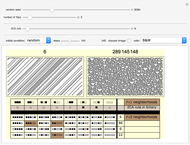 A Strategy for Exploring k=2, r=2 Cellular Automata
John Kiehl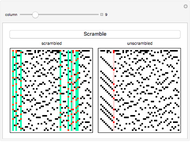 Unscrambling Cellular Automaton Patterns
Paul-Jean Letourneau and Jovan David Rebolledo-Mendez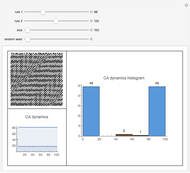 Histogram of Flipping Cellular Automaton
Daniel de Souza Carvalho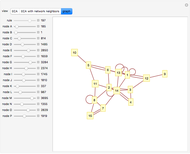 Elementary Cellular Automaton with Network
Francis A. Bitonti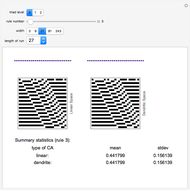 Cellular Automaton Rules on Dendrites
Jim Gerdy Monoliths in Cellular Automaton 146
Abigail Nussey