Connecting the CDF and the PDF


Requires a Wolfram Notebook System
Interact on desktop, mobile and cloud with the free Wolfram Player or other Wolfram Language products.
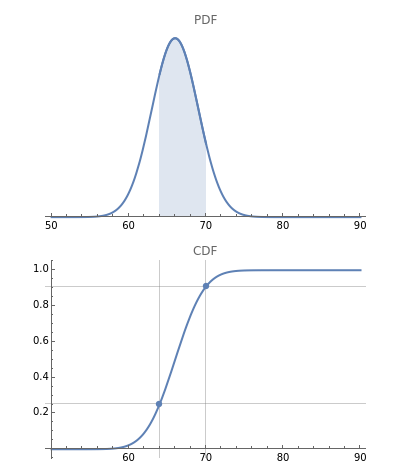
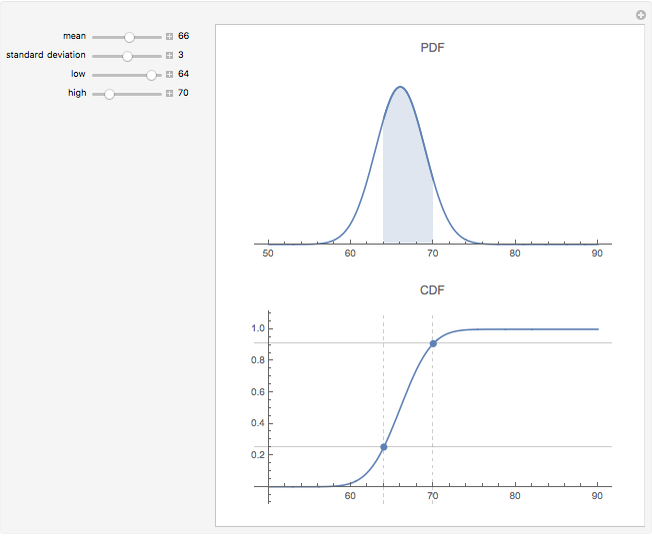
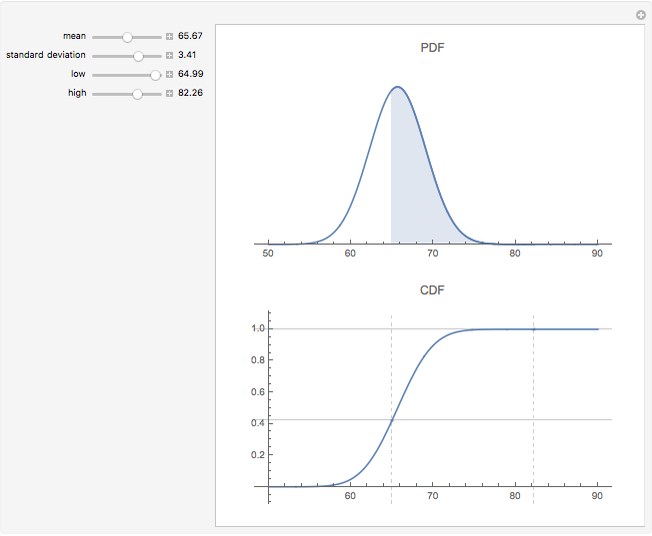
The probability density function (PDF - upper plot) is the derivative of the cumulative density function (CDF - lower plot). This elegant relationship is illustrated here. The default plot of the PDF answers the question, "How much of the distribution of a random variable is found in the filled area; that is, how much probability mass is there between observation values equal to or more than 64 and equal to or fewer than 70?"
[more]
Contributed by: Roger J. Brown (November 2007)
Reproduced by permission of Academic Press from Private Real Estate Investment ©2005
Open content licensed under CC BY-NC-SA
Details
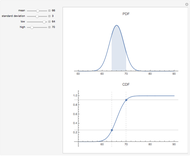
The calculations here are based on the normal distribution, which is completely determined by its mean and standard deviation. Changing these values changes the result of probability estimates. In the first snapshot you can see that the chance of seeing a value at or below 70 is approximately 81%. There is no need to subtract as in the default view because the lower bound of 50 is presumed to have a zero probability.
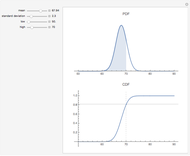
The second snapshot shows that it does not matter which side is filled. The procedure for finding the probability of particular random variables is the same. In the third snapshot the filled portion of the PDF plot is too narrow to visualize, a reminder that a single point has no probability mass for a continuous distribution. (To avoid problems in the illustration there is a tiny difference between the high and low points—65 versus 64.99—that may be ignored for purposes of the exposition.) The points in the CDF plot overlap visually, also showing that the probability of being between two values goes to zero as the values approach each other for a continuous distribution.
More information is available in Chapter Five of Private Real Estate Investment and at mathestate.com.
R. J. Brown, Private Real Estate Investment: Data Analysis and Decision Making, Burlington, MA: Elsevier Academic Press, 2005.
Snapshots


Permanent Citation
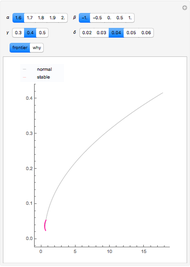
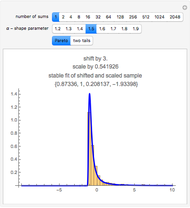
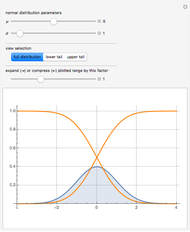 Exploring the Tails of the Normal Distribution
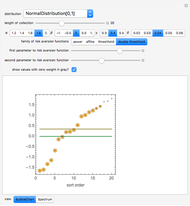
Joe O'Hara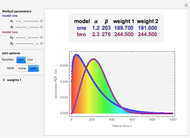 Comparing and Weighting Two Weibull Models
Frederick Wu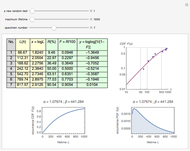 Fitting Lifetime Data to a Weibull Model
Frederick Wu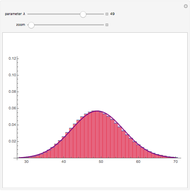 Normal Approximation to a Poisson Random Variable
Chris Boucher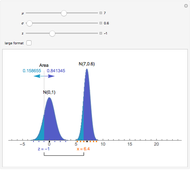 Area of a Normal Distribution
Eric Schulz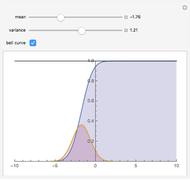 Logistic Sigmoid Market Model
Michael Schreiber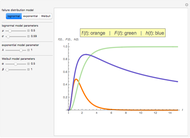 Reliability Distributions
Joe O'Hara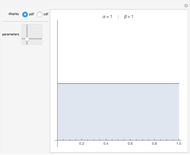 Beta Distribution
Fiona Maclachlan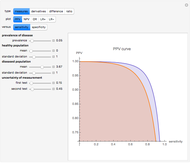 Uncertainty of Measurement and Diagnostic Accuracy Measures
Aristides T. Hatjimihail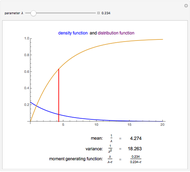 The Exponential Distribution
Chris Boucher
-
 Connecting the CDF and the PDF
Roger J. Brown -
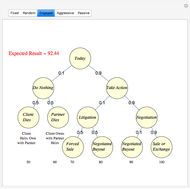 Dissolving Partnerships
Roger J. Brown -
 Forming the Efficient Frontier When Returns Are Non-Normal
Roger J. Brown -
 Spectral Measures
Roger J. Brown -
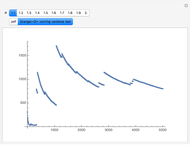 Granger-Orr Running Variance Test
Roger J. Brown -
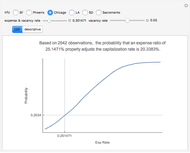 Capitalization Rate Probability
Roger J. Brown -
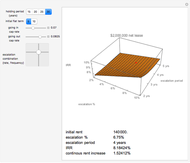 Net Lease Economics
Roger J. Brown -
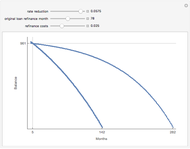 The Refinance Decision
Roger J. Brown -
 True Cost of Variable Rate Mortgage Funds
Roger J. Brown -
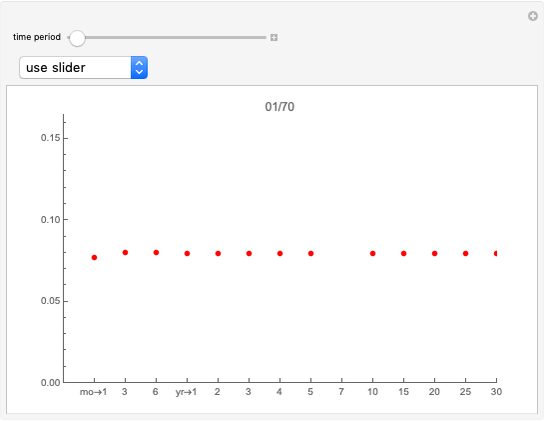 Term Structure of Interest Rates
Roger J. Brown -
 Generalized Central Limit Theorem
Roger J. Brown -
 Inflation-Adjusted Yield
Roger J. Brown -
 Simulating the IRR
Roger J. Brown -
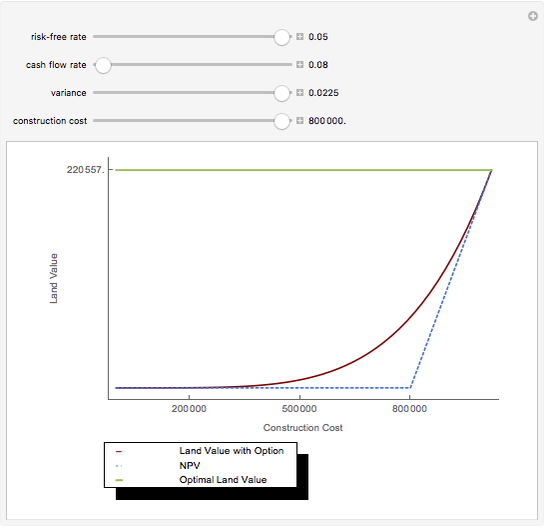 Real Options
Roger J. Brown -
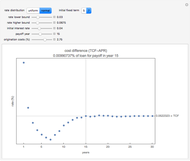
 The Price-Terms Tradeoff
Roger J. Brown -
 Fitting an Elephant
Roger J. Brown -
 Solving the Subprime Loan Problem
Roger J. Brown -
 Why Location Matters: The Bid Rent Curve
Roger J. Brown -
 Explaining Real Estate Price Bubbles
Roger J. Brown -
 Value Added Growth Model
Roger J. Brown