Construction of the Rate-Conversion-Temperature Chart from Kinetic Data

Requires a Wolfram Notebook System
Interact on desktop, mobile and cloud with the free Wolfram Player or other Wolfram Language products.
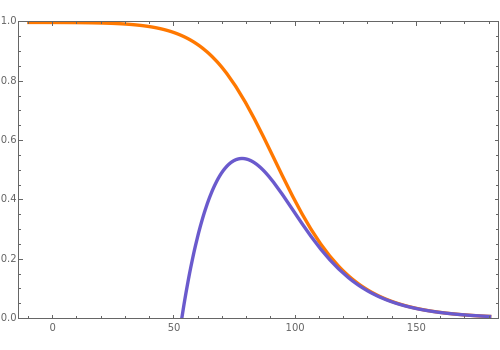
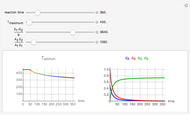
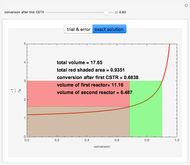
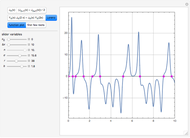
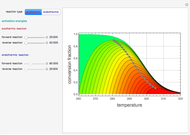
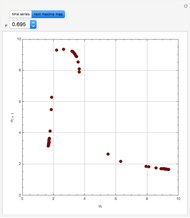
Consider a first-order reversible exothermic reaction  . This Demonstration represents the conversion versus temperature (the blue curve) for values of the reaction rate selected by the user. The orange curve corresponds to the equilibrium conversion (i.e., when the reaction rate equals zero). This equilibrium curve is typical of exothermic reversible reactions. Indeed the equilibrium conversion approaches zero and one at high and low temperatures, respectively.
Contributed by: Housam Binous (March 2011)
Open content licensed under CC BY-NC-SA
Snapshots
Details
Reaction rate is given by:
 ,
,
where  is the conversion and
  .
.
The rate constants are given by:
 and
and  , (expressed in
  ).
).
Reference: O. Levenspiel, Chemical Reaction Engineering, 3rd ed., New York: Wiley, 1999.
Permanent Citation
