Correlation of Bivariate Random Data


Requires a Wolfram Notebook System
Interact on desktop, mobile and cloud with the free Wolfram Player or other Wolfram Language products.
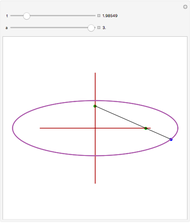
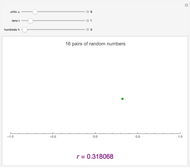
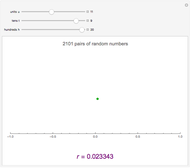
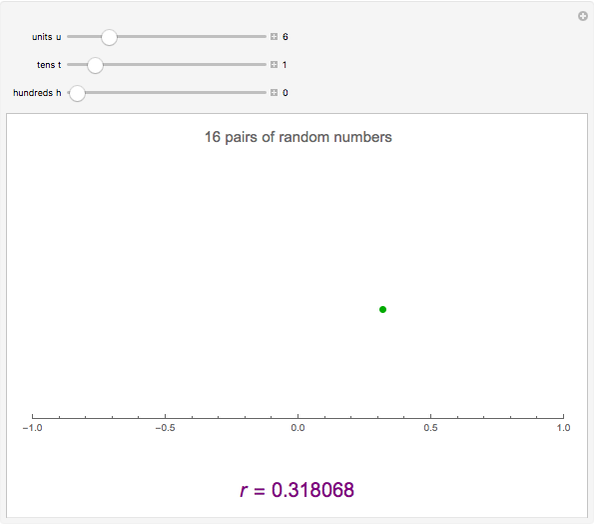
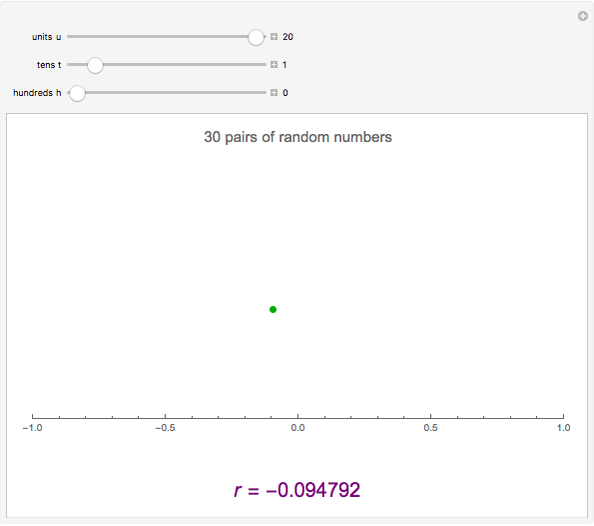
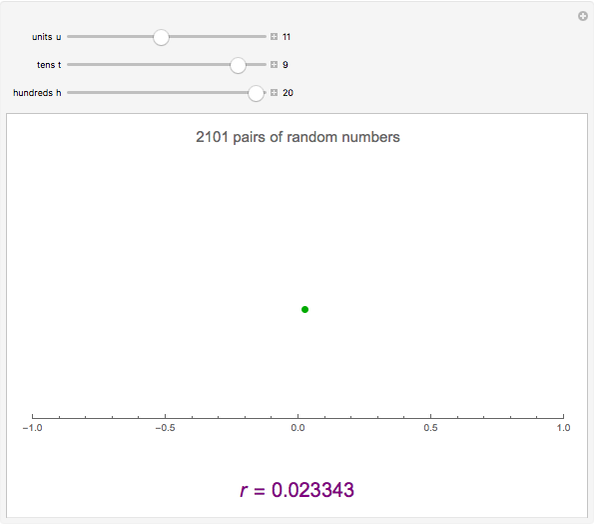
This Demonstration constructs two lists of random numbers of length  and calculates the Pearson product-moment correlation coefficient
  as if the lists were bivariate data. For a random sample such as this, the coefficient is expected to be close to zero, with no correlation. As you increase the sample size with the sliders, the coefficient (shown with the green dot) fluctuates less and less as it floats over zero.
Contributed by: Jamie Wickham-Jones (March 2011)
Open content licensed under CC BY-NC-SA
Snapshots

Details
This computes a standard statistical quantity, the coefficient of correlation. Those studying this material for a statistics course will recognize several features in the initialization and will see how the coefficient is calculated. (The correlation can be computed directly via the built-in Mathematica function Correlation.)
Permanent Citation
"Correlation of Bivariate Random Data"
http://demonstrations.wolfram.com/CorrelationOfBivariateRandomData/
Wolfram Demonstrations Project
Published: March 7 2011
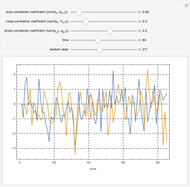 Bivariate First-Order Vector Autoregression Model with Correlated Random Shocks
N. Baris Vardar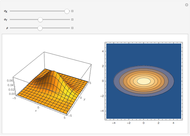 Joint Density of Bivariate Gaussian Random Variables
John M. Shea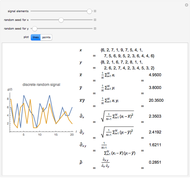 Correlation and Covariance of Random Discrete Signals
Daniel de Souza Carvalho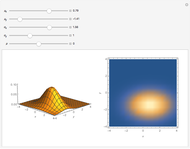 The Bivariate Normal Distribution
Chris Boucher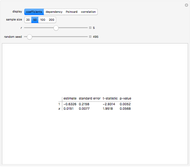 Hidden Correlation in Regression
Ian McLeod and Yun Shi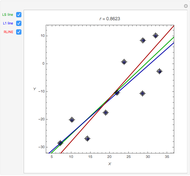 Correlation and Regression Explorer
Ian McLeod (The University of Western Ontario) Marginal Normality Does Not Imply Bivariate Normality
Ehsan Azhdari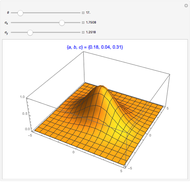 Intuitive Parameterization of the Bivariate Normal Distribution
Robert L. Brown The Bivariate Normal and Conditional Distributions
Chris Boucher Data Smoothing
Jon McLoone