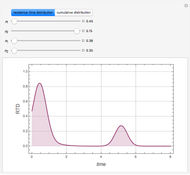
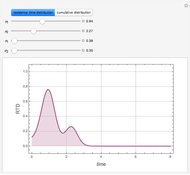
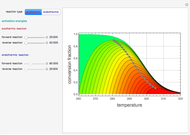
Cumulative Distribution and Residence Time Distribution Curves
Initializing live version


Requires a Wolfram Notebook System
Interact on desktop, mobile and cloud with the free Wolfram Player or other Wolfram Language products.
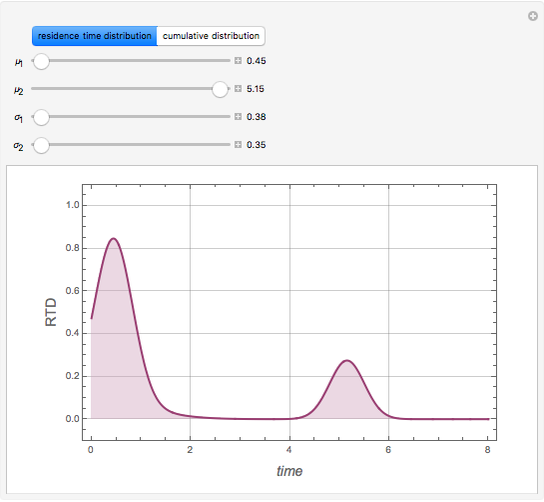
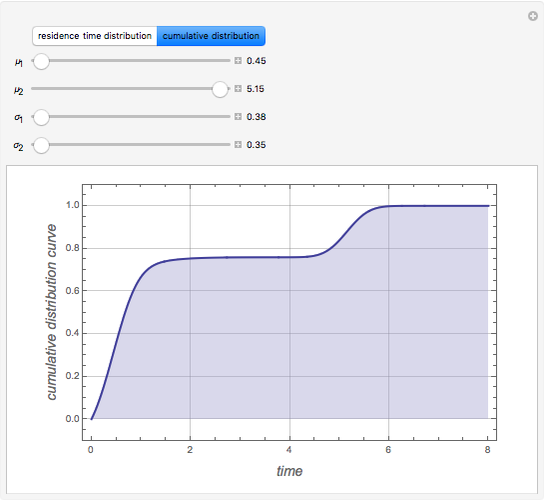
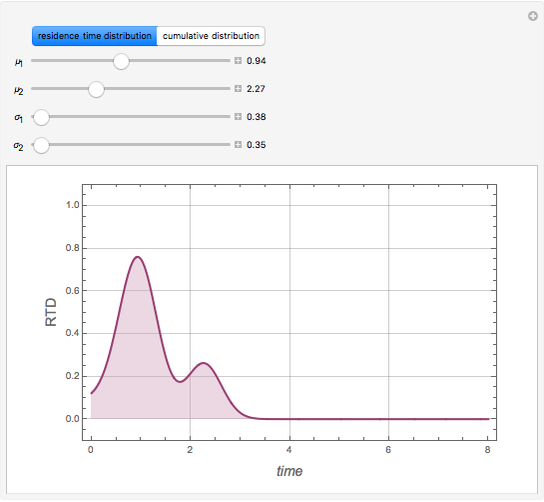
Consider the following mixture distribution:
[more]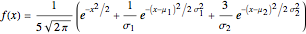


Contributed by: Housam Binous and Ahmed Bellagi (April 2011)
Open content licensed under CC BY-NC-SA
Snapshots

Details
Reference
[1] H. S. Fogler, Elements of Chemical Reaction Engineering, 3rd ed., Upper Saddle River, NJ: Prentice Hall, 1999.
Permanent Citation
Related Demonstrations
More by Author
 Residence Time Distribution of Single Continuous Stirred-Tank Reactors Subject to a Square Pulse Input
Housam Binous and Ahmed Bellagi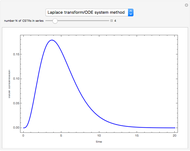 Residence Time Distribution for Continuous Stirred-Tank Reactors in Series Using the First Four Moments
Housam Binous and Ahmed Bellagi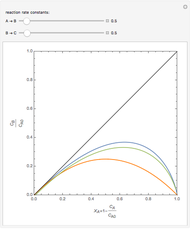 Product Distribution Curves for Laminar, Plug, and Mixed Flows
Housam Binous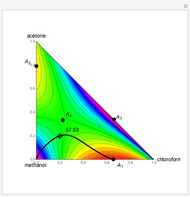 Residue Curve and Bubble Temperature Distribution for a Ternary Mixture
Housam Binous, Ikbel El Glaoui, and Ahmed Bellagi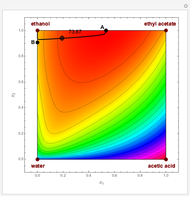 Residue Curve and Temperature Distribution for Ethyl Acetate Chemistry
Housam Binous, Ikbel El Glaoui, and Ahmed Bellagi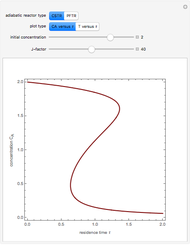 Variation of Temperature and Concentration versus Residence Time for Adiabatic Reactors
Housam Binous and Ahmed Bellagi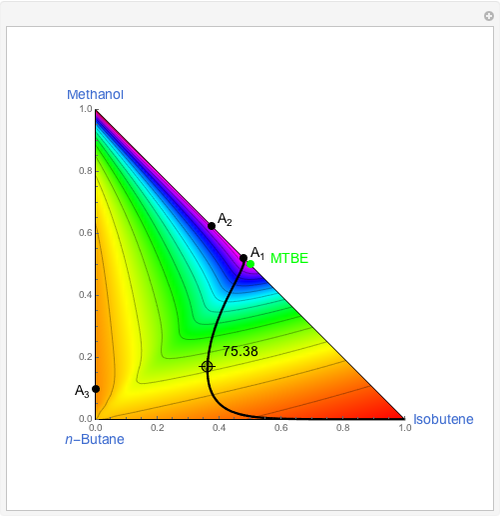 Residue Curve and Bubble Temperature Distribution for Methyl Tert-Butyl Ether Chemistry at 8 atm
Housam Binous, Ikbel El Glaoui, and Ahmed Bellagi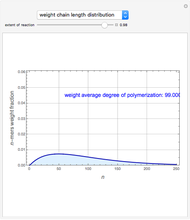 Molecular Weight Distribution in Equilibrium Step-Growth Polymerizations
Mamdouh Al-Harthi and Housam Binous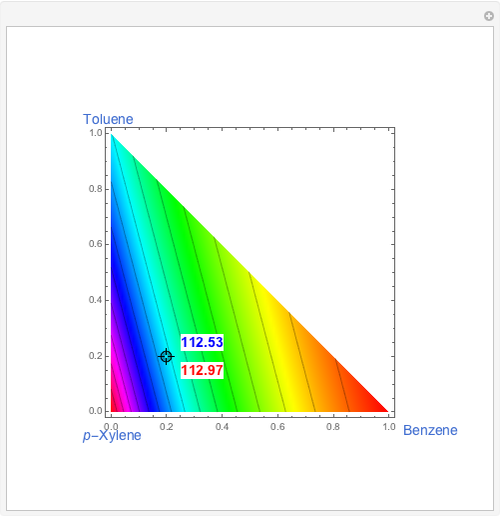 Approximate Bubble Temperature Distribution for Benzene, Toluene, p-Xylene Ternary Mixture
Housam Binous and Ahmed Bellagi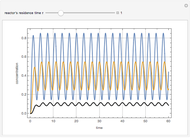 Series Reactions in a CSTR with Time-Varying Input
Housam Binous and Ahmed Bellagi
-
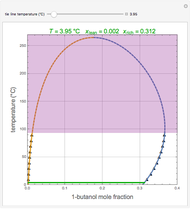 Liquid-Liquid Equilibrium for the 1-Butanol-Water System
Ahmed Bellagi -
 Temperature Dependence of Dehydrogenation of Ethyl Benzene to Styrene
Ahmed Bellagi -
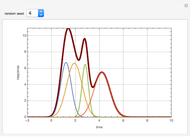 Deconvolution of a Chromatogram
Ahmed Bellagi -
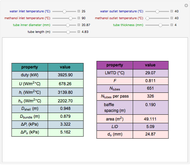 Design of a Shell and Tube Heat Exchanger
Ahmed Bellagi -
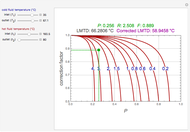 Correction Factor for Shell and Tube Heat Exchanger
Ahmed Bellagi -
 Contour Plots for Reaction Rates
Ahmed Bellagi -
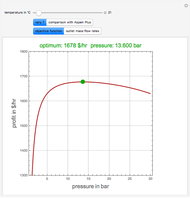 Optimal Conditions for CO2/n-Hexane Flash Separation
Ahmed Bellagi -
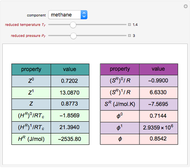
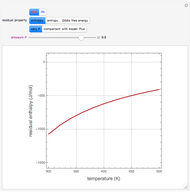 Residual Functions for the SRK and PR Equations of State
Ahmed Bellagi -
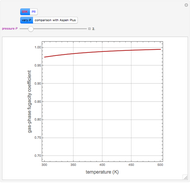 Gas-Phase Fugacity Coefficients for Propylene
Ahmed Bellagi -
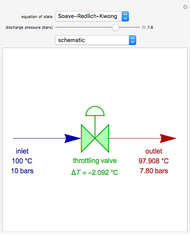 Operation of a Throttling Valve
Ahmed Bellagi -
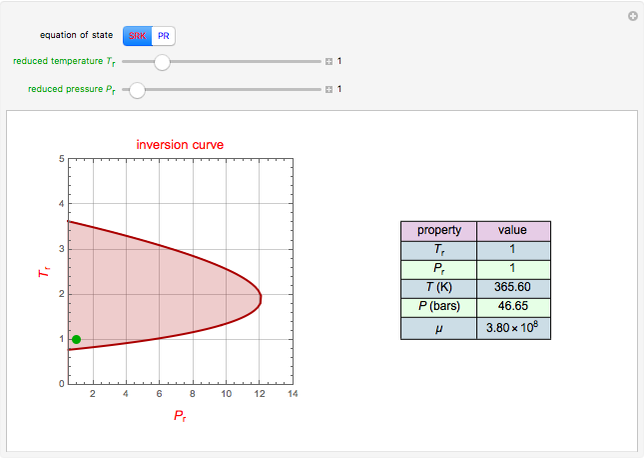 Joule-Thomson Inversion Curves for Soave-Redlich-Kwong (SRK) and Peng-Robinson (PR) Equations of State
Ahmed Bellagi -
 Lee-Kesler Generalized Correlations for Gases
Ahmed Bellagi -
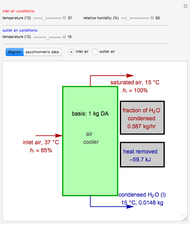 Operation of an Air Conditioner
Ahmed Bellagi -
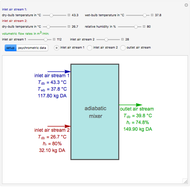 Adiabatic Mixing of Two Moist Air Streams
Ahmed Bellagi -
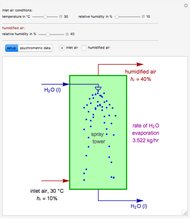 Adiabatic Humidification
Ahmed Bellagi -
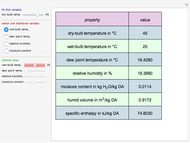
 Psychrometric Data Calculator in English Engineering Units
Ahmed Bellagi -
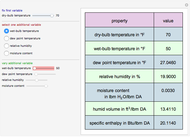
 Psychrometric Data Calculator in SI Units
Ahmed Bellagi -
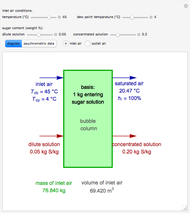 Concentration of Sugar Solution in a Bubble Column
Ahmed Bellagi -
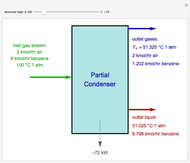 Operation of a Partial Condenser
Ahmed Bellagi -
 Steam Reforming of Propane
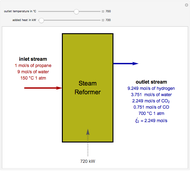
Ahmed Bellagi