Data Sampling and Interpolation


Requires a Wolfram Notebook System
Interact on desktop, mobile and cloud with the free Wolfram Player or other Wolfram Language products.
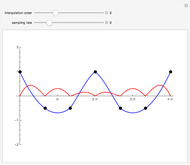
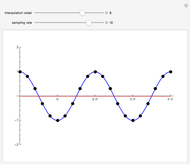
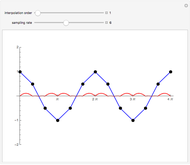
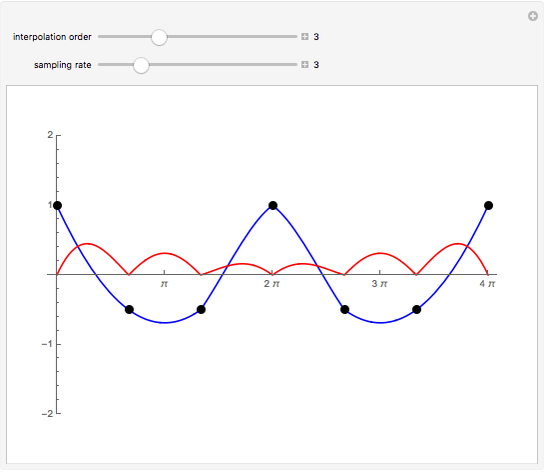
Using a simple cosine wave as an example, this Demonstration shows how the number of data points and the interpolation order affect the resulting interpolating function. The blue line represents the plot of the interpolating function, the red line represents the numerical difference between the interpolating function values and the true values of the sinusoid, and the black points are the points used in the interpolation. The sampling rate corresponds to the number of sample points per oscillation.
Contributed by: Brian Van Vertloo (March 2011)
Open content licensed under CC BY-NC-SA
Snapshots


Details
detailSectionParagraphPermanent Citation
"Data Sampling and Interpolation"
http://demonstrations.wolfram.com/DataSamplingAndInterpolation/
Wolfram Demonstrations Project
Published: March 7 2011
 Interpolating a Set of Data
Stephen Wolfram Simple Spline Curves
Richard Phillips and Rob Morris Obtuse Angle Shadowing Networks and Distance-Based Interpolation
Ingolf Dahl Knot Vector Generation for B-Spline Interpolation
Isabelle Cattiaux-Huillard and Gudrun Albrecht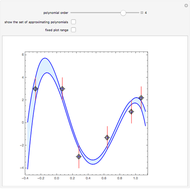 Interpolating Vertical Segments
Evgenija D. Popova and Radostin Surilov Algorithm for Cubic Nonuniform B-Spline Curve Interpolation
Shutao Tang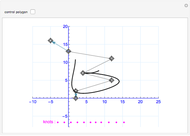 Interpolating B-Spline Curves with Boundary Conditions
M. Szilvási-Nagy Fitting Noisy Data
Rob Morris Curve Fitting
Theodore Gray Fitting an Elephant
Roger J. Brown