Distribution of Digits in Several Math Constants
Initializing live version

Requires a Wolfram Notebook System
Interact on desktop, mobile and cloud with the free Wolfram Player or other Wolfram Language products.
By breaking up the math constants  ,
,  ,
,  and
and  (an approximation to
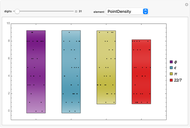
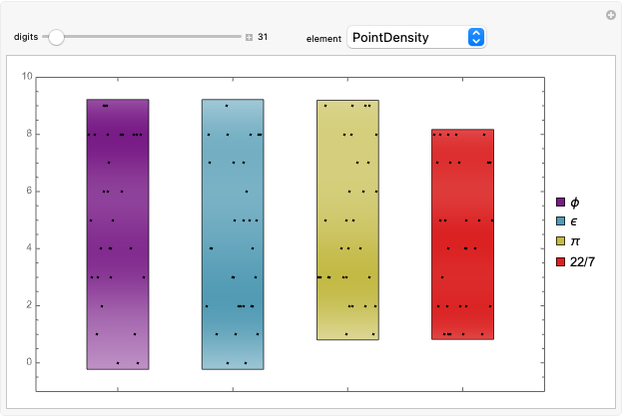
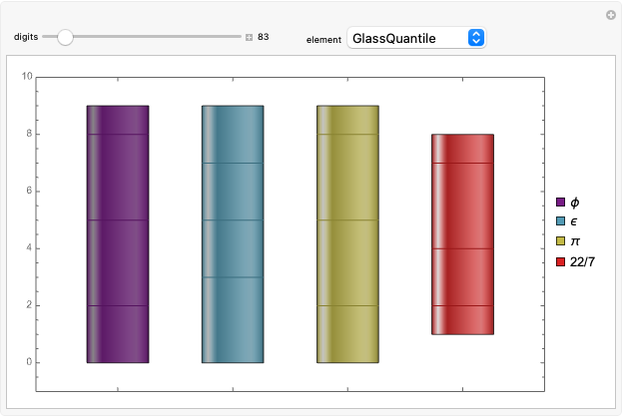
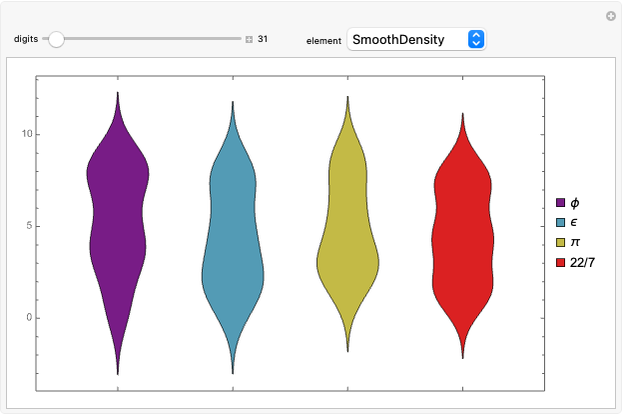
  ) into discrete digits, we can visually compare their distributions with the built-in Wolfram Language function DistributionChart. This illustrates the distributions of numerical data for one or more groups of numbers using density curves in which the width of each curve corresponds to the approximate frequency of data points in each region.
Contributed by: Daniel de Souza Carvalho (October 12)
Open content licensed under CC BY-NC-SA
Details
Snapshots


Permanent Citation
Related Demonstrations
More by Author
 Randomness in the Digits of Pi
Stephen Wolfram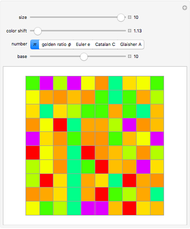 Digit Mosaics
Hector Zenil Random Walk Generated by the Digits of Pi
Minjie Lei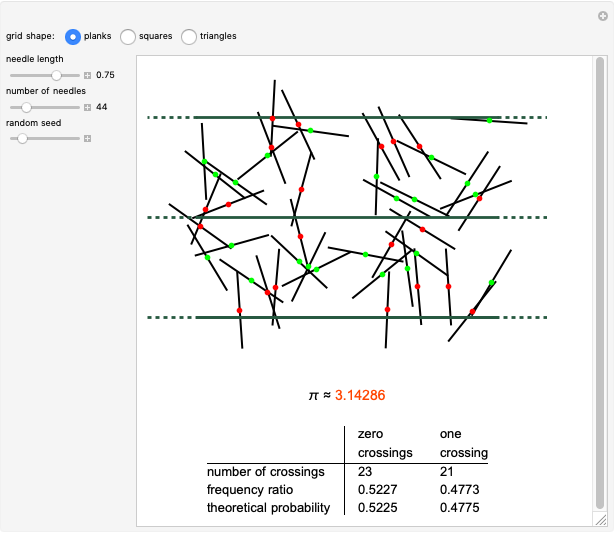 Buffon's Needle Experiment for Three Types of Grids
Enis Siniksaran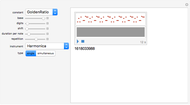 Math Songs
Hector Zenil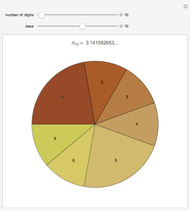 Pi Digits Pie
Hector Zenil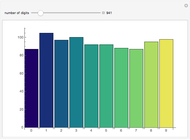 Pi Digits Bar Chart
Hector Zenil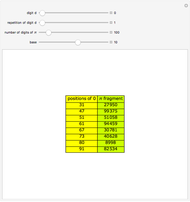 Consecutive Digits in the Expansion of Pi
Hector Zenil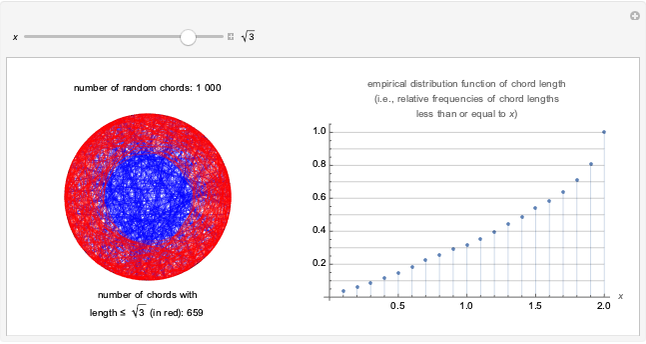 Observed Distribution of Random Chord Lengths in a Circle
Tomas Garza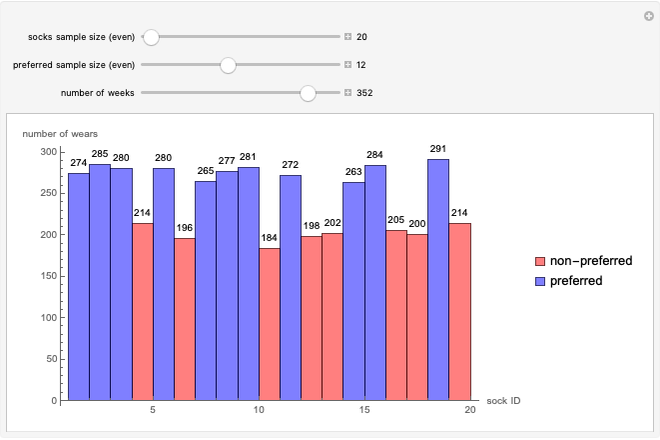 How Many Socks Do Two Feet Wear Out?
S.A.
-
 Distribution of Digits in Several Math Constants
Daniel de Souza Carvalho -
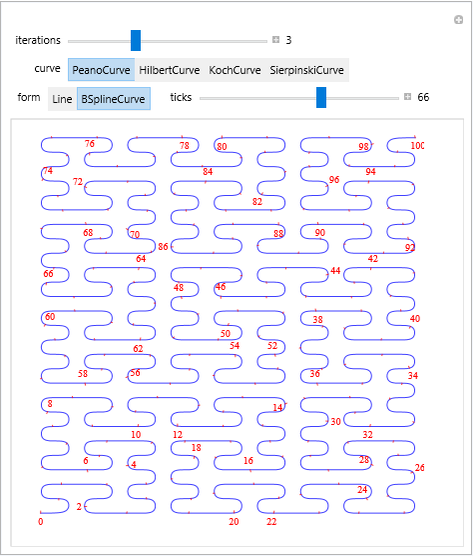 Space-Filling Fractal Curves
Daniel de Souza Carvalho -
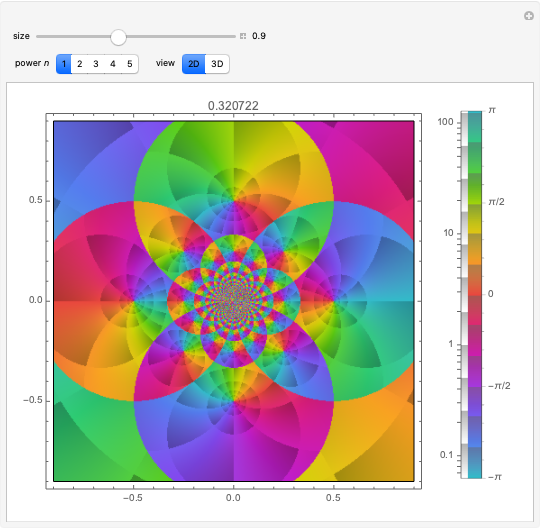 Intricate Patterns from a Simple Complex Function
Daniel de Souza Carvalho -
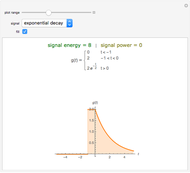 Energy and Power of Signals
Daniel de Souza Carvalho -
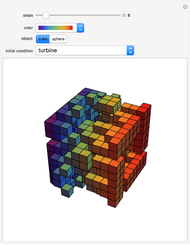 Game of Life in 3D Layers
Daniel de Souza Carvalho -
 Hacker's Symbol: The Glider in the Game of Life
Daniel de Souza Carvalho -
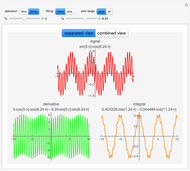 Integrating and Differentiating Trigonometric Signals
Daniel de Souza Carvalho -
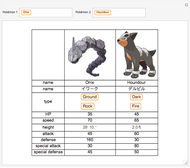 Comparing Pokémon
Daniel de Souza Carvalho -
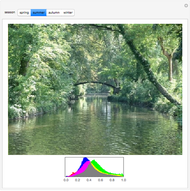 Image Histograms of the Four Seasons
Daniel de Souza Carvalho -
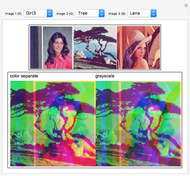 Combining Image Color Layers
Daniel de Souza Carvalho -
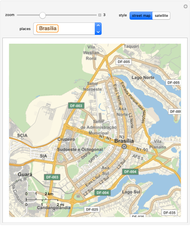 View Our Small World
Daniel de Souza Carvalho -
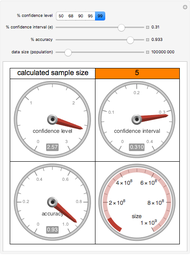 Calculating Sample Size
Daniel de Souza Carvalho -
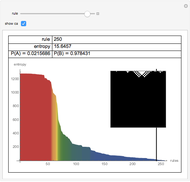 Cellular Automata Ordered by Entropy
Daniel de Souza Carvalho -
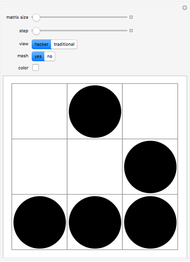
 Smooth Density Histograms for Cellular Automata
Daniel de Souza Carvalho -
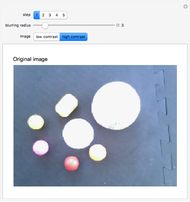 Counting Objects in Images
Daniel de Souza Carvalho -
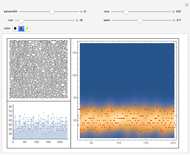
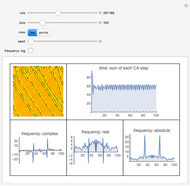 Frequency of Cellular Automata
Daniel de Souza Carvalho -
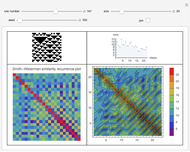 Applying the Smith-Waterman Similarity to Cellular Automata
Daniel de Souza Carvalho -
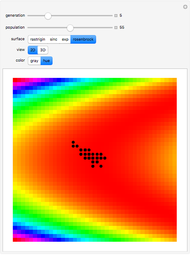 Global Minimum of a Surface
Daniel de Souza Carvalho -
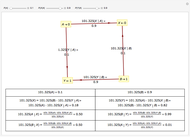 Probability in a Communication Channel
Daniel de Souza Carvalho -
 Algorithmic Complexity and Big-O Notation
Daniel de Souza Carvalho