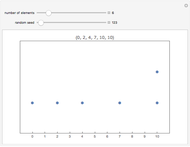
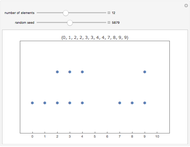
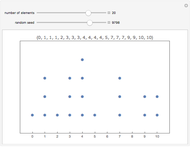
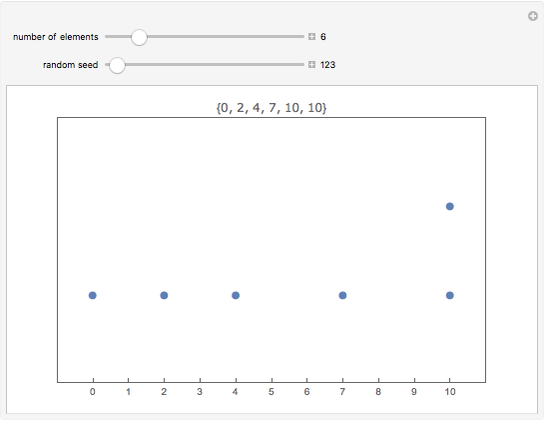
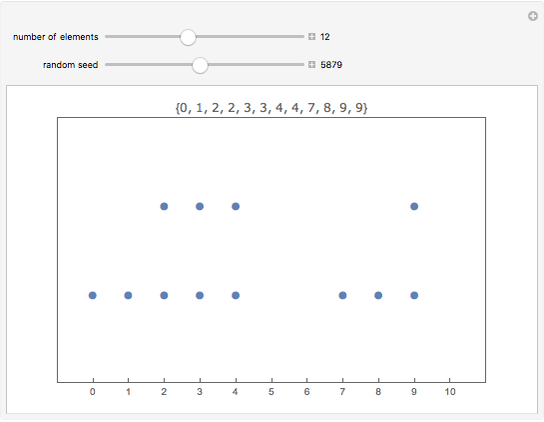
Dot Plot


Requires a Wolfram Notebook System
Interact on desktop, mobile and cloud with the free Wolfram Player or other Wolfram Language products.
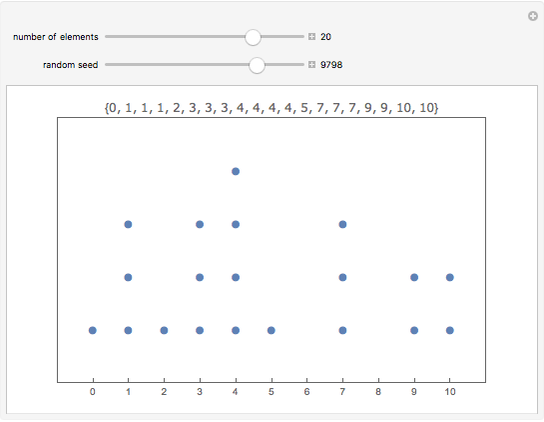
The dot plot has been used for years as a simple exploratory method to visualize small discrete datasets.
Contributed by: Craig Bauling (August 2011)
Open content licensed under CC BY-NC-SA
Snapshots

Details
A simple but effective way to display data, the dot plot has been used for hundreds of years as a way to visualize small discrete datasets. Often they are hand drawn. Attempts to re-create the traditional hand-drawn plots by computer systems typically result in approximations using the histogram chart format. Using Mathematica's advanced computational capability we can quickly re-create the exactness of the hand-drawn plots.
For more information, see Dot plot.
Permanent Citation
"Dot Plot"
http://demonstrations.wolfram.com/DotPlot/
Wolfram Demonstrations Project
Published: August 29 2011
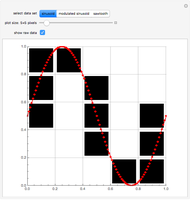 Rasterization of a Data Plot
Paul van der Schaaf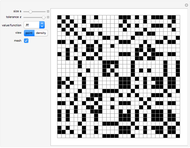 Recurrence Plot of Mathematical Functions and Constants
Daniel de Souza Carvalho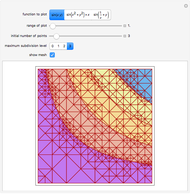 Adaptive Contour Plotting
Stephen Wolfram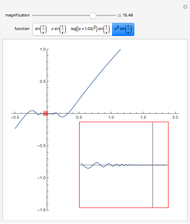 Inset Plot Magnifier
Ed Pegg Jr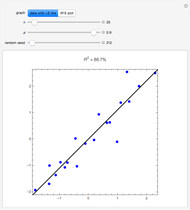 Residual-Fit Spread Plot
Ian McLeod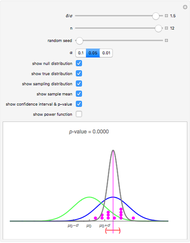 One-Sample t-Test and Confidence Interval with Dot Chart in Small Samples
Douglas Woolford and Ian McLeod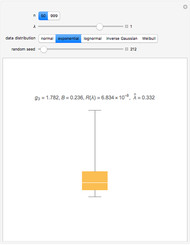 Choosing a Data Transformation with the Box-Whisker Plot
Ian McLeod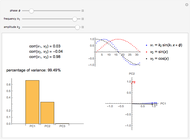 Loading Plot of a Principal Component Analysis (PCA)
D. Meliga and S. Z. Lavagnino Informal Power Assessment of the Normal Probability Plot
Ian McLeod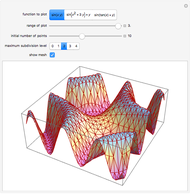 Adaptive 3D Plotting
Stephen Wolfram