Double Marginalization and Supply Chains

Requires a Wolfram Notebook System
Interact on desktop, mobile and cloud with the free Wolfram Player or other Wolfram Language products.
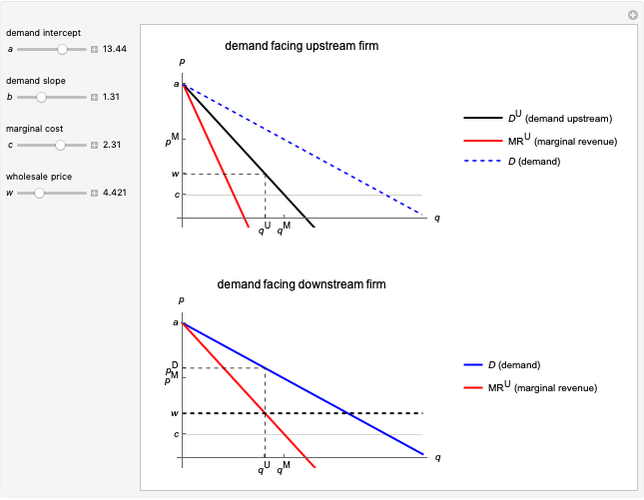
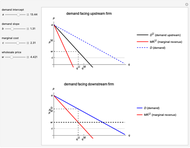
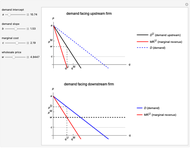
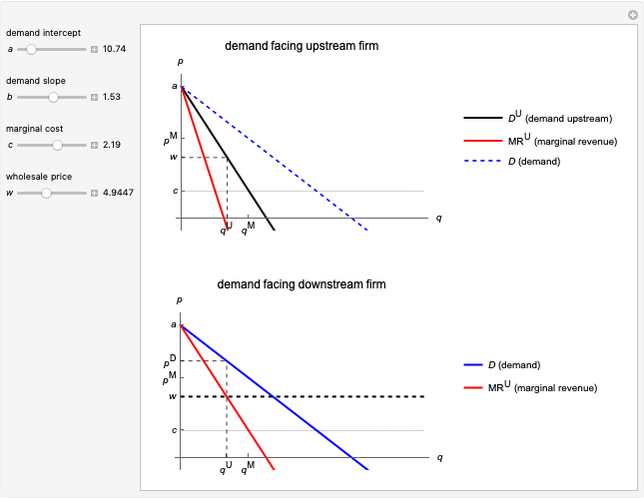
This Demonstration illustrates the issue of double marginalization in a vertical market with an upstream monopolist firm and a downstream monopolist firm facing inverse demand function  . The upstream firm has constant marginal costs
  . The lower graph shows the demand (blue) and marginal revenue (red) curves of the downstream firm, while the upper graph shows the induced demand (black) and marginal revenue (red) curves of the upstream firm. The coefficients of the market demand are
  (demand intercept) and
  (demand slope). The marginal cost is
  and the wholesale price is
  . For a given wholesale price
  , the lower graph can be used to understand how the downstream firm chooses how much to produce (and hence demand from the upstream firm) and which price to charge. The graphs show the monopoly price
  and quantity
  , as well as the upstream quantity
  and downstream price
  .
.


Contributed by: Flavio Toxvaerd (August 2022)
(University of Cambridge)
Open content licensed under CC BY-NC-SA
Snapshots


Details
Reference
[1] Wikipedia. "Double Marginalization." (Oct 5, 2021) en.wikipedia.org/wiki/Double_marginalization.
Permanent Citation
 Supply Curve from Piecewise Linear Cost Function
Timur Gareev Supply and Demand Excise Tax
Nicholas Palmer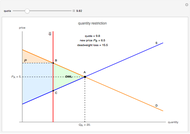 Supply and Demand Quantity Restriction
Nicholas Palmer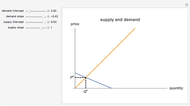 Basic Supply and Demand
Mark Gillis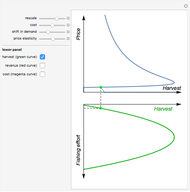 The Backward-Bending Supply Function in Fisheries
Arne Eide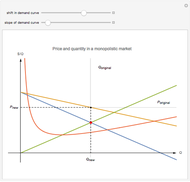 No Supply Curve in a Monopolistic Market
Samuel G. Chen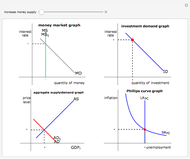 How Increasing the Money Supply Affects the Economy
Matthew Rosenfield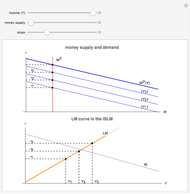 Deriving the Liquidity Preference-Money Supply (LM) Curve
Nicholas Palmer How Continuous Innovation Affects Supply, Producer Surplus, and Consumer Surplus
John B. Horowitz, Michael A. Karls, Juan Sesmero, and T. Norman Van Cott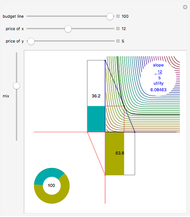 Marginal Utility Budget Line
Michael Schreiber