Fortune's Algorithm for Voronoi Diagrams


Requires a Wolfram Notebook System
Interact on desktop, mobile and cloud with the free Wolfram Player or other Wolfram Language products.
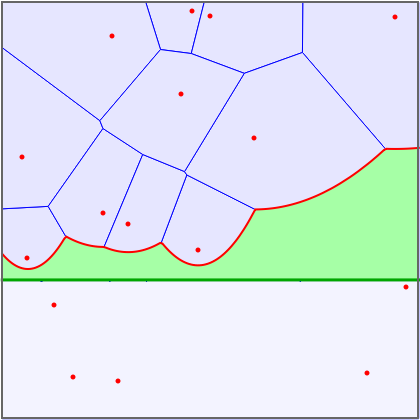
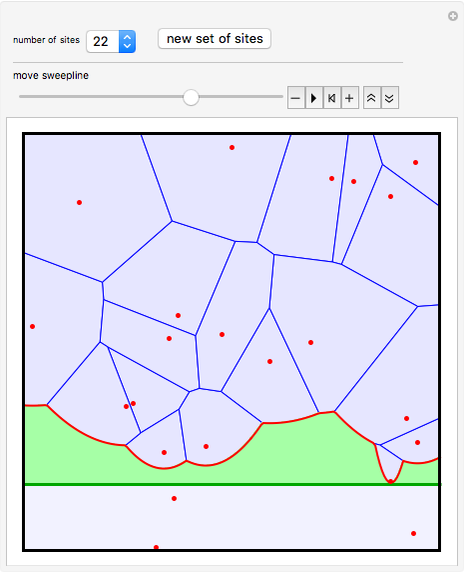
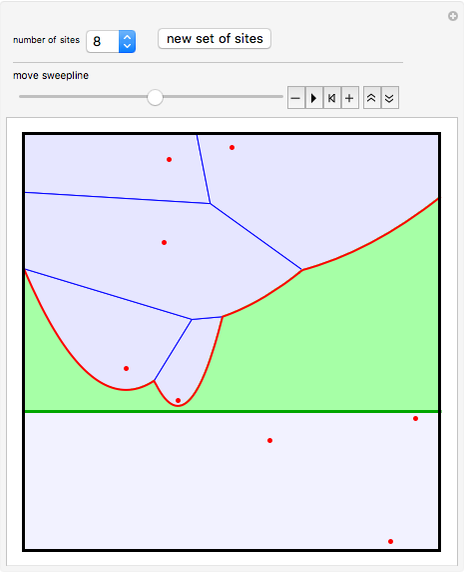
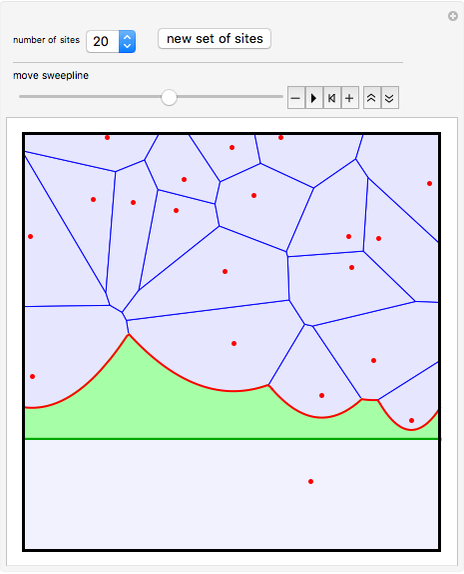
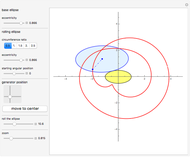
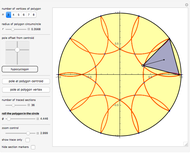
Given a finite set of points (called sites) in a plane, a Voronoi diagram divides the plane into regions around each site that are closer to that site than to any of the others. This Demonstration shows Fortune's algorithm for drawing Voronoi diagrams [1].
[more]
Contributed by: Erik Mahieu (July 2016)
Open content licensed under CC BY-NC-SA
Snapshots
Details
Reference
[1] S. Fortune, "A Sweepline Algorithm for Voronoi Diagrams," Algorithmica, 2, 1987 pp. 153–174. www.wias-berlin.de/people/si/course/files/Fortune87-SweepLine-Voronoi.pdf.
Permanent Citation
"Fortune's Algorithm for Voronoi Diagrams"
http://demonstrations.wolfram.com/FortunesAlgorithmForVoronoiDiagrams/
Wolfram Demonstrations Project
Published: July 19 2016
 Voronoi Diagrams
Ed Pegg Jr and Jeff Bryant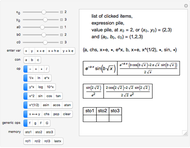 Automatic Differentiation
Roger B. Kirchner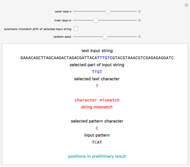 Brute-Force String Matching
Michael Schreiber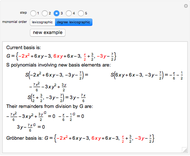 The Buchberger Gröbner Basis Algorithm
Andrzej Kozlowski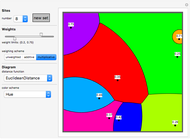 Weighted Voronoi Diagrams
Erik Mahieu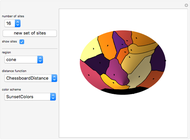 Voronoi Diagrams on Three-Dimensional Surfaces
Erik Mahieu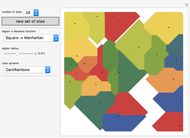 Constructing Voronoi Diagrams with Expanding Cells
Erik Mahieu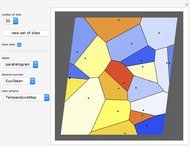 Voronoi Diagrams in Two-Dimensional Regions
Erik Mahieu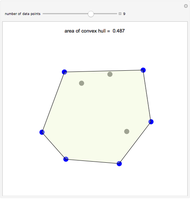 Convex Hull
Eric W. Weisstein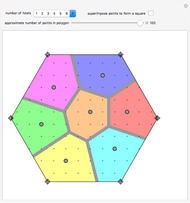 The Facilities Location Problem
Tim Neuman and Stan Wagon
-
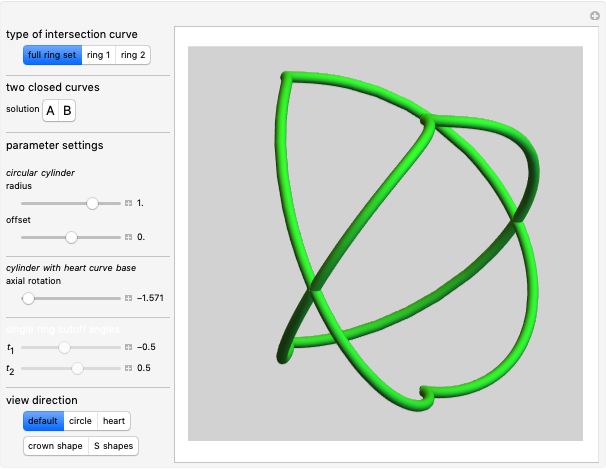 4. Ambiguous Rings Based on a Heart Curve
Erik Mahieu -
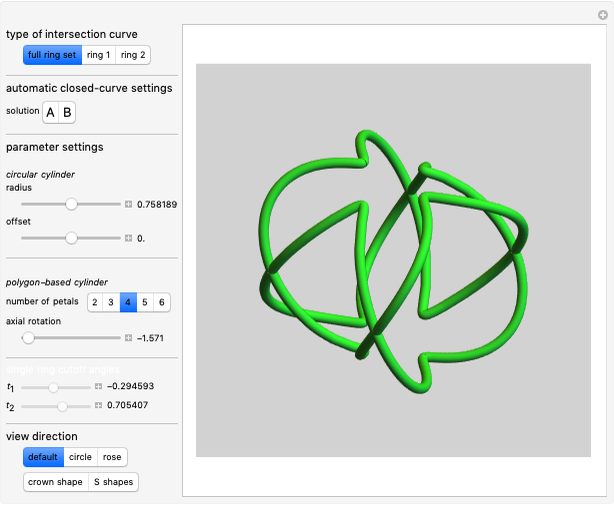 3. Ambiguous Rings Based on a Rose Curve
Erik Mahieu -
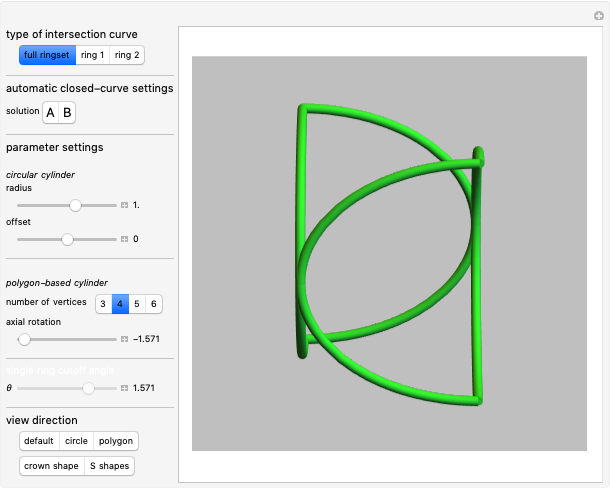 2. Ambiguous Rings Based on a Polygon
Erik Mahieu -
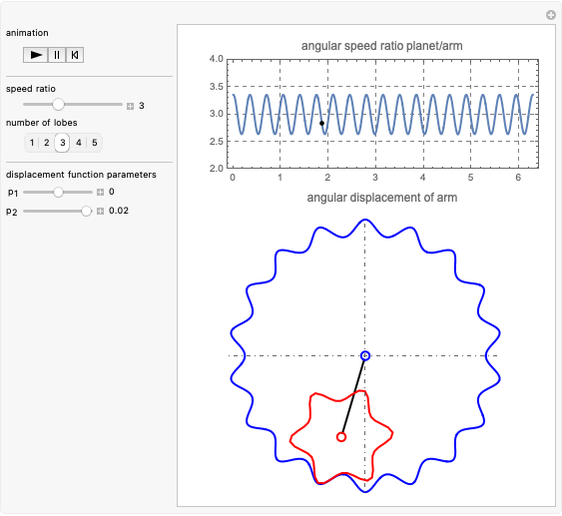 Noncircular Planetary Drive
Erik Mahieu -
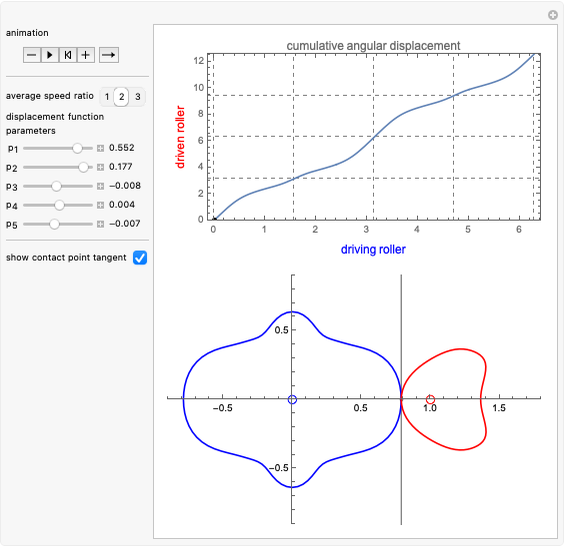 Noncircular Roller Drive
Erik Mahieu -
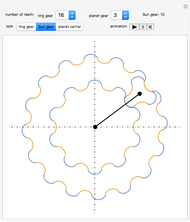 Planetary Gear Train
Erik Mahieu -
 Rolling Cycloidal Curves
Erik Mahieu -
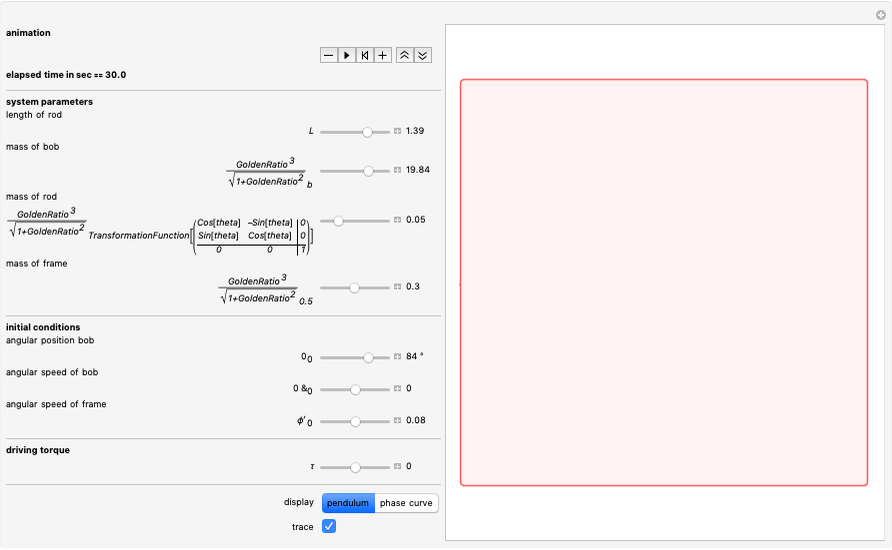 Driven Spherical Pendulum
Erik Mahieu -
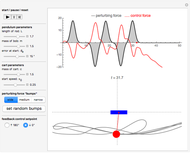 Automatic Feedback Control of a Pendulum-and-Cart System
Erik Mahieu -
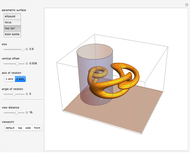
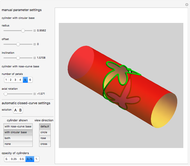 Intersection of a Generalized Cylinder over a Rose Curve with a Circular Cylinder
Erik Mahieu -
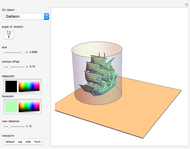
 1. Ambiguous Rings
Erik Mahieu -
 Elliptic Epitrochoid
Erik Mahieu -
 Intersection of Two Polygonal Cylinders
Erik Mahieu -
 Designs from Mechanical Linkages
Erik Mahieu -
 3D Extrusion Using the Frenet-Serret System
Erik Mahieu -
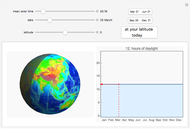 Daylight Calculator
Erik Mahieu -
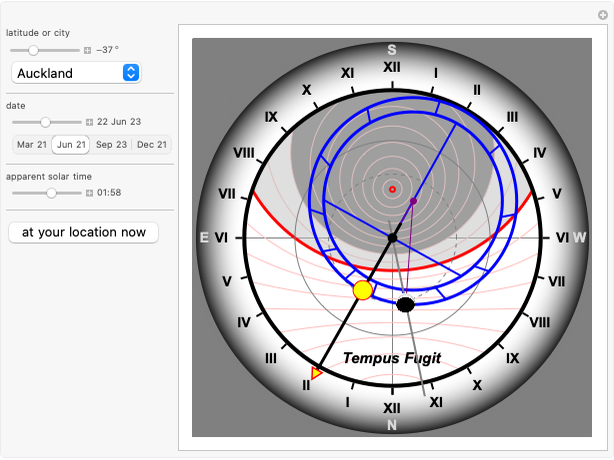 Astronomical Clock
Erik Mahieu -
 Cylindrical Anamorphosis of 3D Polygonal Meshes
Erik Mahieu -
 Cylindrical Anamorphosis of Parametric Surfaces
Erik Mahieu -
 Roulette (Hypotrochogon) of a Polygon Rolling inside a Circle
Erik Mahieu