Franck-Condon Principle in Vibronic Transitions


Requires a Wolfram Notebook System
Interact on desktop, mobile and cloud with the free Wolfram Player or other Wolfram Language products.
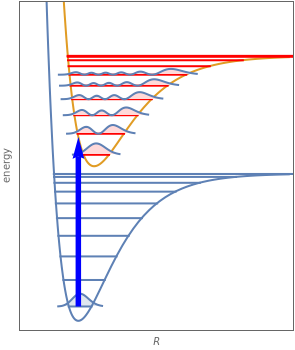
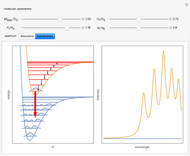
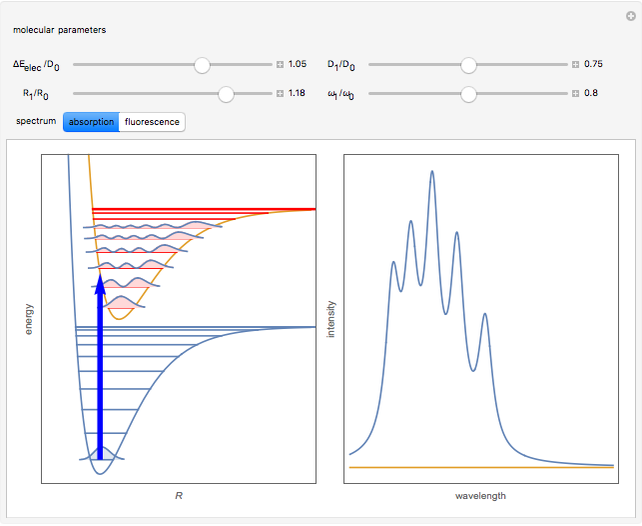
When a diatomic molecule undergoes a transition to an excited electronic state higher by  , it generally changes its vibrational and rotational quantum numbers as well. In the liquid state, the individual rotational levels are not generally resolved and the resulting process is characterized as a vibronic transition. Both the ground and excited electronic states are represented by potential energy curves, shown in blue and red, respectively, on the left-hand graphic. The probability densities of the first few ground state and excited-state vibrational levels,
  and
and  , are shown, superposed on the vibrational energy-level diagrams, with
  ,
,  ,
,  , …. Here the superscripts refer to the electronic state, while the subscripts label the vibrational level.


Contributed by: S. M. Blinder (January 2012)
Open content licensed under CC BY-NC-SA
Snapshots

Details
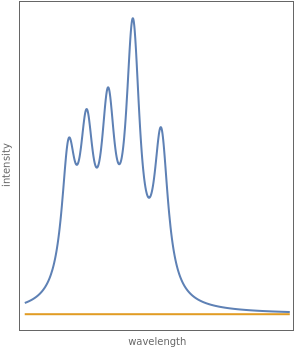
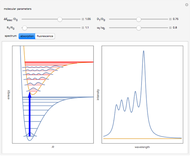
Snapshot 1: the vibrational peaks in the absorption spectrum are notated, right to left, by  ,
,  ,
,  ,
,  , etc.; the peak is dominant here since
  and
and  differ only slightly
Snapshot 2: absorption spectrum with the peak as the most intense
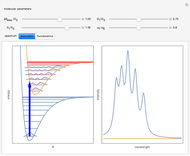
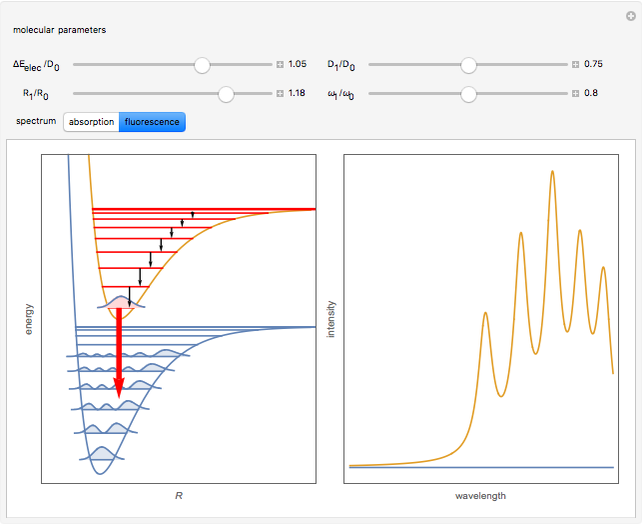
Snapshot 3: corresponding fluorescence spectrum; the peaks are notated, left to right, by  ,
,  ,
,  ,
,  , etc.; note the near mirror image shapes of the absorption and fluorescence spectra
Reference
[1] S. M. Blinder, Introduction to Quantum Mechanics, Amsterdam: Elsevier, 2004 pp. 229–232.
Permanent Citation
 Rotation-Vibration Energy Level Transitions of a Diatomic Rotor
Whitney R. Hess and Lisa M. Goss (Idaho State University)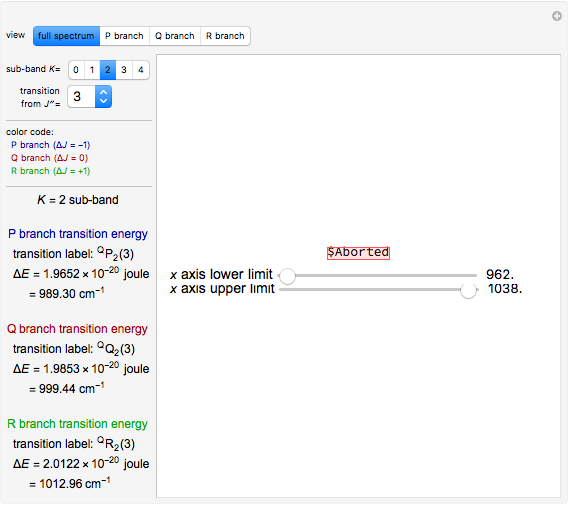 Rotation-Vibration Transitions of a Parallel Band of a Symmetric Rotor
Whitney R. Hess and Lisa M. Goss Aharonov-Bohm Effect
S. M. Blinder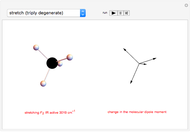 Infrared and Raman Vibrational Spectra of Methane
D. Meliga and S. Z. Lavagnino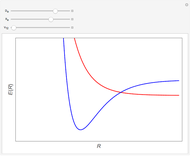 Non-Crossing Rule for Energy Curves in Diatomic Molecules
S. M. Blinder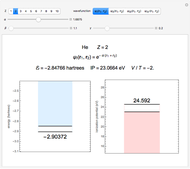 Two-Parameter Variational Functions for the Helium Isoelectronic Series
Wai-Kee Li and S. M. Blinder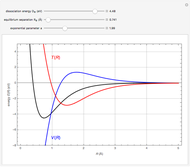 Virial Theorem for Diatomic Molecules
S. M. Blinder Schrödinger Equation for a Dirac Bubble Potential
S. M. Blinder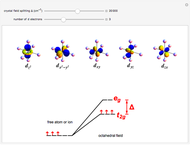 d-Orbitals in an Octahedral Field
S. M. Blinder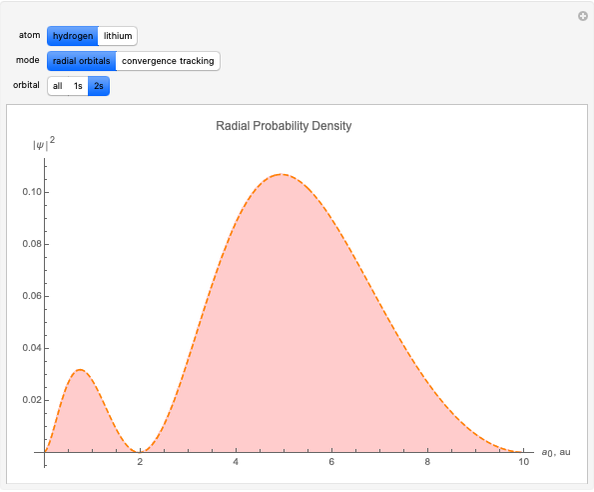 Hydrogen and Lithium Orbitals Using a Hartree Eigenvalue Method
Nikita M. Kostylev
-
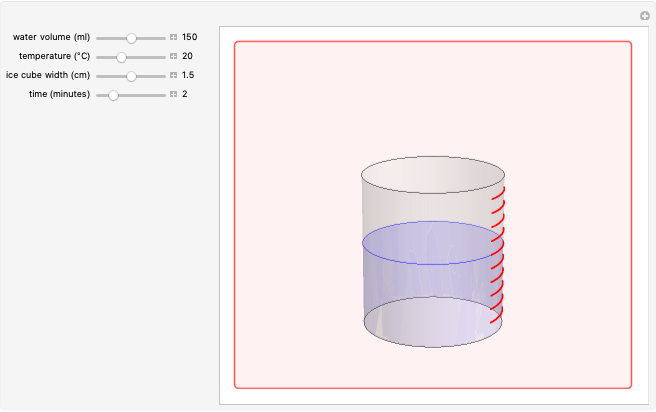 Ice Cube Melting in Water
S. M. Blinder -
 Absorption Spectroscopy
S. M. Blinder -
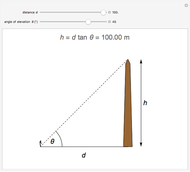 Height of Object from Angle of Elevation Using Tangent
S. M. Blinder -
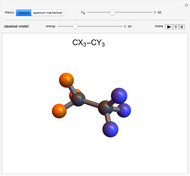 Internal Rotation in Ethane and Substituted Analogs
S. M. Blinder -
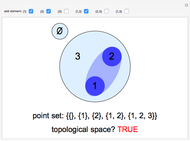 Topological Spaces on Three Points
S. M. Blinder -
 Hydrogen Atom in Curved Space
S. M. Blinder -
 Multipurpose Tool
S. M. Blinder -
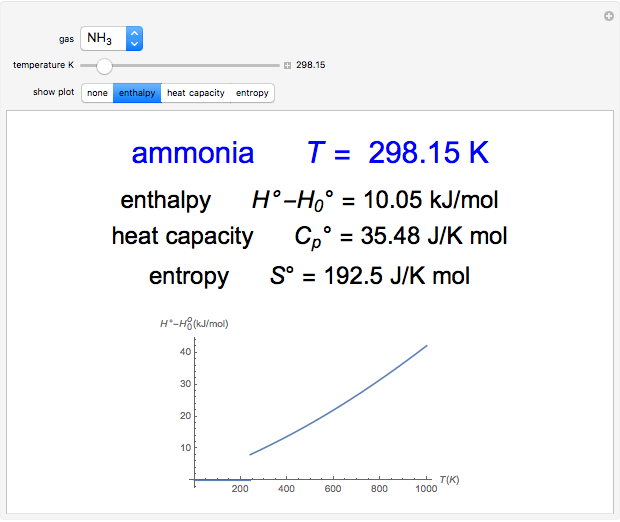 Statistical Thermodynamics of Ideal Gases
S. M. Blinder -
 Bell's Theorem
S. M. Blinder -
 Kepler's Mysterium Cosmographicum
S. M. Blinder -
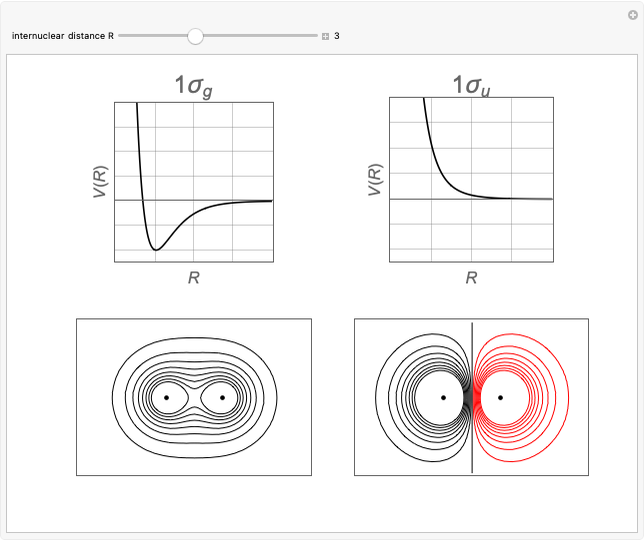 Bonding and Antibonding Molecular Orbitals
S. M. Blinder -
 Visible and Invisible Intersections in the Cartesian Plane
S. M. Blinder -
 Heron's Formula
S. M. Blinder -
 How Zippers Work
S. M. Blinder -
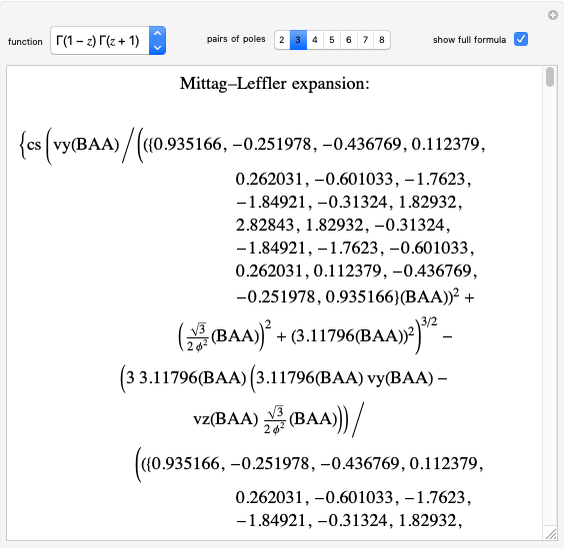 Mittag-Leffler Expansions of Meromorphic Functions
S. M. Blinder -
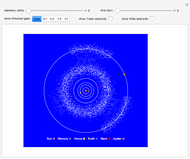 Orbital Resonance in the Asteroid Belt
S. M. Blinder -
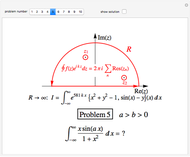 Jordan's Lemma Applied to the Evaluation of Some Infinite Integrals
S. M. Blinder -
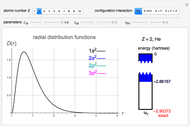 Configuration Interaction for the Helium Isoelectronic Series
S. M. Blinder -
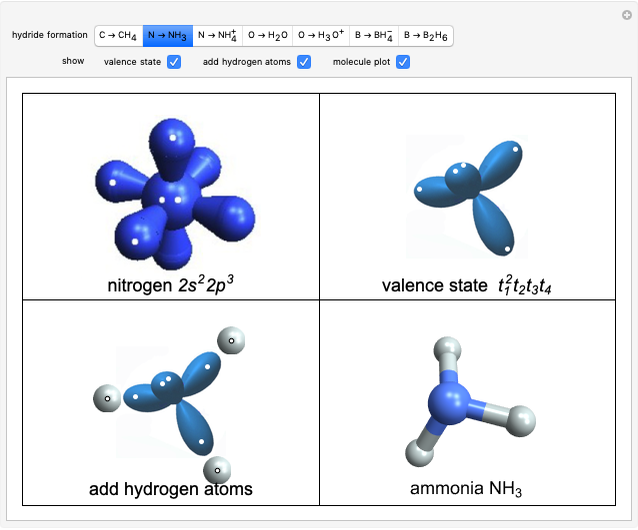 Structure and Bonding of Second-Row Hydrides
S. M. Blinder -
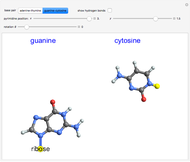 DNA Base Pairing
S. M. Blinder