Frictional Pressure Drop in a Pipe


Requires a Wolfram Notebook System
Interact on desktop, mobile and cloud with the free Wolfram Player or other Wolfram Language products.
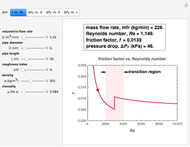
This Demonstration calculates and displays the pressure drop in a pipe due to friction as a function of the liquid's volumetric flow rate, the pipe's diameter, length, and degree of roughness, and the liquid's density and viscosity. It also calculates and displays the liquid's mass flow rate, the Reynolds number, and the corresponding friction factor. You can choose one of the following plots to display: the friction factor versus Reynolds number (Moody diagram) or the pressure drop versus the flow rate, the pipe's diameter, or its length.
Contributed by: Mark D. Normand and Micha Peleg (March 2011)
Open content licensed under CC BY-NC-SA
Snapshots


Details
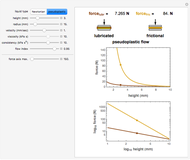
Snapshot 1: oil in a smooth pipe in laminar flow
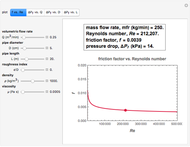
Snapshot 2: water in a smooth pipe in turbulent flow
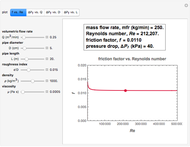
Snapshot 3: water in a rough pipe in turbulent flow
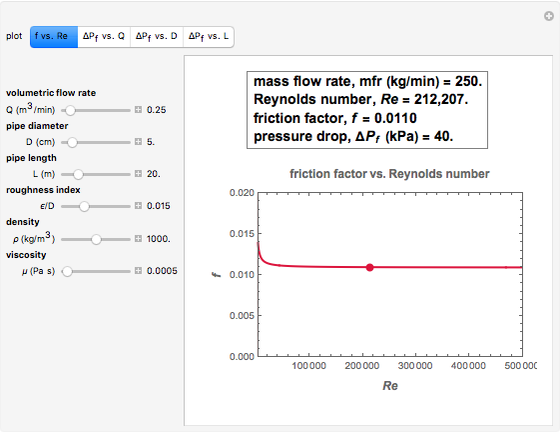
Snapshot 4: concentrated dextrin solution in a smooth pipe in turbulent flow
This Demonstration calculates the pressure of a liquid in a pipe,  (in kPa), as a function of its volumetric flow rate,
  (in
(in  /min), the pipe's diameter,
  (in cm), length,
  (in m), and degree of roughness,
  (dimensionless), and the liquid's density,
  (in kg/), and viscosity,
  (in Pa s). It also calculates and displays the liquid's mass flow rate,
  (in kg/s), the Reynolds number,
  (dimensionless), and the friction factor,
  (dimensionless).
A Reynolds number of less than 2100 implies laminar flow, in which case, according to the Hagen–Poiseuille equation,  . A Reynolds number greater than 4000 implies turbulent flow, for which there are different ways to estimate the friction factor,
  . The one used in this Demonstration, commensurate with the Moody diagram in the cited references, is based on the numerical solution of the equation
 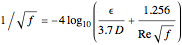 .
.
A transition from laminar to turbulent flow or vice versa occurs when  , in which case the use of either equation should be done with caution. This region is shaded in pink on the versus plot.
The displayed plot type is chosen with one of the following setters: vs. (the Moody diagram), versus , versus , or versus . Use the sliders to enter the current values of the parameters , , , , , and . The conditions corresponding to the current settings of the parameters are marked as colored dots on the plots. The numerical values of , , , and are displayed in a box above each plot.
Note that the pipe's roughness only affects the friction factor in the turbulent regime.
To apply the Demonstration to pipe lengths greater than 100 m, simply scale a smaller result.
References:
D. W. Green and R. H. Perry, Perry's Chemical Engineer's Handbook, New York, NY: McGraw–Hill, 2008.
C. J. Geankoplis, Transport Processes and Unit Operations, 2nd ed., Boston: Allyn and Bacon, 1983.
Permanent Citation
 Lubricated and Frictional Squeezing Flow
Mark D. Normand and Micha Peleg Oil-Drop Experiment
D. Meliga and S.Z. Lavagnino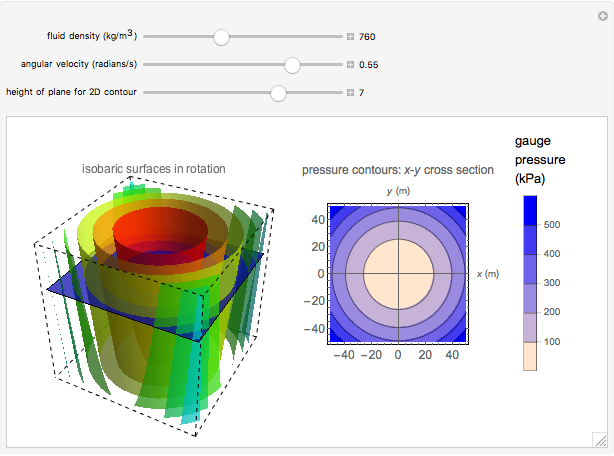 Pressure of a Rotating Fluid
Megan Maguire and Rachael L. Baumann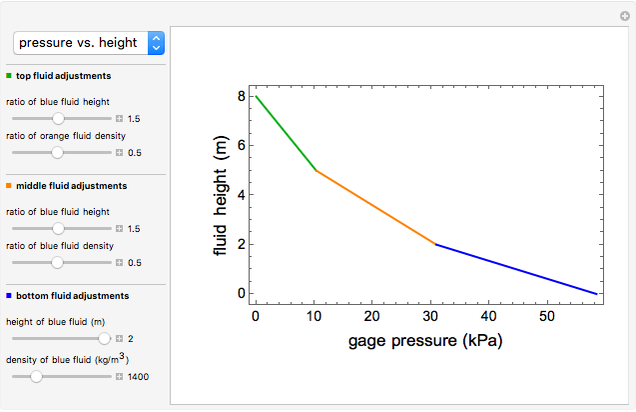 Pressure Profile for Column of Multiple Fluids
Jon Barbieri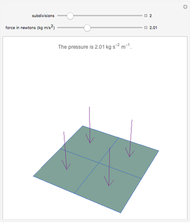 Pressure
Enrique Zeleny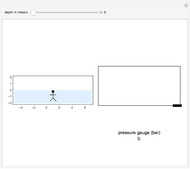 Hydrostatic Pressure
Fernando Blanco Galán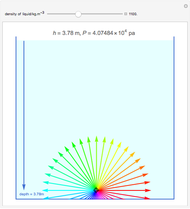 Fluid Pressure
Anping Zeng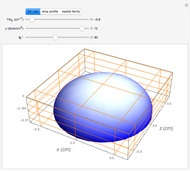 Configuration of a Sessile Drop
Brian Higgins and Housam Binous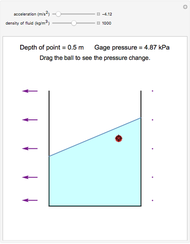 Pressure within an Accelerating Container
Jon Barbieri and Peter Hassinger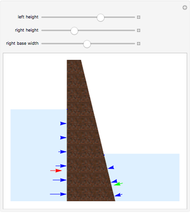 Equivalent Forces Due to Hydrostatic Pressure on a Dam
Enrique Zeleny
-
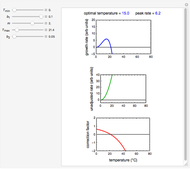 Ratkowski's Square Root Growth Rate Model for High Temperatures
Micha Peleg -
 Gordon-Taylor and Fox Equations for Glass Transition Temperature
Micha Peleg -
 Force to Overcome Vacuum Pull
Micha Peleg -
 Extending the Square Root Growth Rate Model to Lethal Low Temperatures
Micha Peleg -
 Probability of Being Strange According to Paulos
Micha Peleg -
 Successive Three-Point Method for Weibullian Chemical Degradation
Micha Peleg -
 Estimating Cohesion and Tensile Strength of Compacted Powders
Micha Peleg -
 Three-Endpoints Method for Isothermal Weibullian Chemical Degradation
Micha Peleg -
 Vitamin C Loss in Foods During Heat Processing and Storage
Micha Peleg -
 Parameterizing Temperature-Viscosity Relations
Micha Peleg -
 Laplace Distribution in Fluctuating Stock Index Records
Micha Peleg -
 Weibullian Chemical Degradation
Micha Peleg -
 Simulating Ascorbic Acid Degradation
Micha Peleg -
 Additive and Multiplicative Risks
Micha Peleg -
 Endpoints Method for Predicting Chemical Degradation in Frozen Foods
Micha Peleg -
 Exponential Model for Arrhenius Activation Energy
Micha Peleg -
 Prediction of Isothermal Degradation by the Endpoints Method
Micha Peleg -
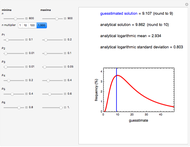 Risk Guesstimation from Factor Ranges
Micha Peleg -
 Volatiles Formation Kinetics in Stored Fish
Micha Peleg -
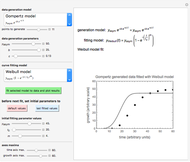 Comparison of Six Sigmoid Growth Curve Models
Micha Peleg