Inflation-Adjusted Yield


Requires a Wolfram Notebook System
Interact on desktop, mobile and cloud with the free Wolfram Player or other Wolfram Language products.
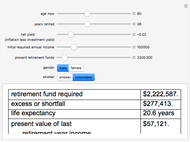
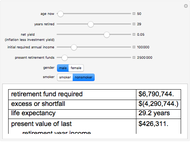
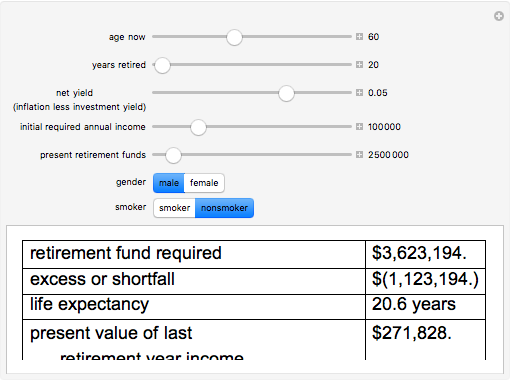
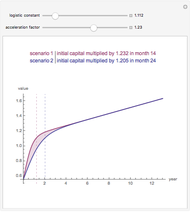
Under the assumption of continuously compounded real investment returns, this Demonstration illustrates how, in the presence of inflation, one's investment life planning turns on the net of nominal investment yield and inflation. Required annual income increases over time if lifestyle is to remain constant, since inflation affects nominal dollars. Yield on present retirement funds has the effect of (a) extending capital and (b) offsetting inflation. Retirement planning often crucially hinges on the net difference between yield and inflation, which can be netted against one another if compounding is continuous.
[more]

Contributed by: Roger J. Brown (March 2011)
Open content licensed under CC BY-NC-SA
Snapshots


Details
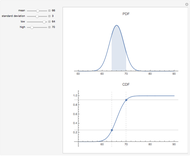
Mortality tables are, at best, a rough guideline. In general, more complicated actuarial computations are necessary. Regardless, this Demonstration should illustrate how incentives are changed by manipulation of the money supply. The decision to save versus spend is influenced by whether and how one can successfully overcome both investment risk and inflation risk. There are two segments of society who are difficult to tax directly: old people (because they vote) and poor people (because it is unconscionable). Inflation becomes a way to tax those segments. As the slider for net yield moves to the right dramatically different outcomes occur as inflation exceeds investment yield.
The interaction of the sliders can also produce some ghoulish implications. One might, given the parameters, be required to not only pick a retirement date but a date of death. Both of these depend on how economic events unfold. There is also an unfortunate but built-in anomaly. While the math of logarithms "smooths" the calculation process, life is, by contrast, bumpy. Spurts of earnings growth are not as perfectly aligned with spurts of inflation as the mathematics in this Demonstration assume.
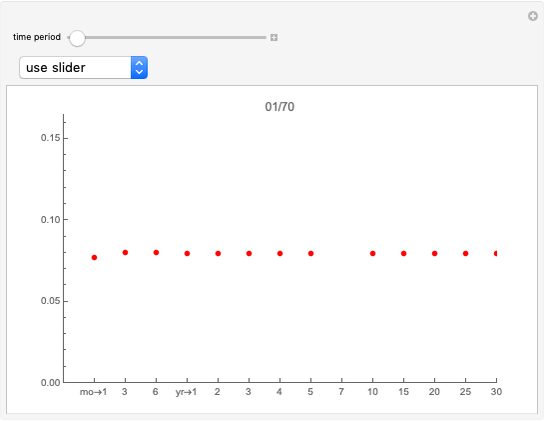
The term "net yield" has a special meaning here: the difference between investment return and inflation. It may seem counterintuitive that moving the slider to the left increases that difference. This arises from the log rule  where
where  and
and  are, respectively, the compounding effect of inflation on the cash flow in the numerator and the discounting effect of investment yield in the denominator of the expansion over time of income and the capital required to support it.
Permanent Citation
 Term Structure of Interest Rates
Roger J. Brown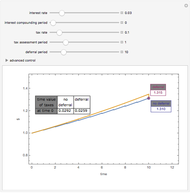 The Value of Tax Deferral
Seth J. Chandler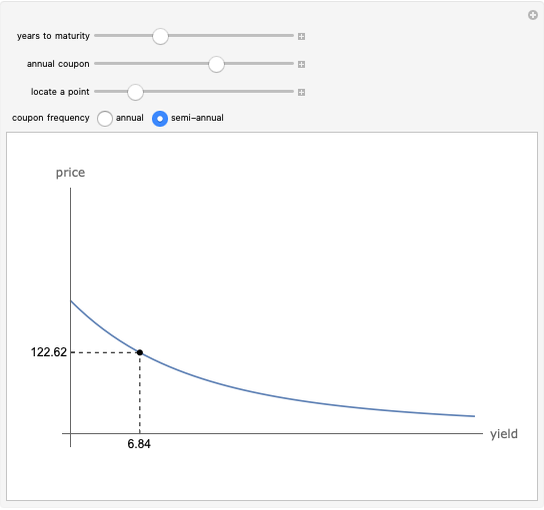 Price-Yield Curve
Fiona Maclachlan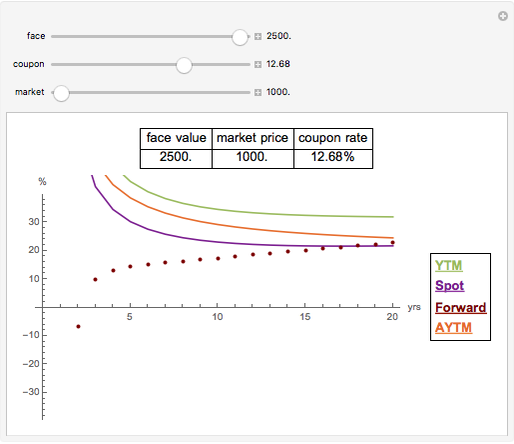 Yield, Spot, and Forward Curves
Gergely Nagy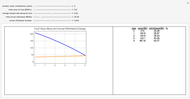 Fund Drawdown Simulation
Joe O'Hara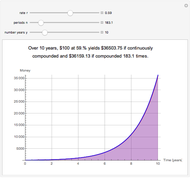 Continuous versus Compounded Interest
Jonathan Scherzer and Yossi Quint Future Value Calculator
Sarah Lichtblau Present Value Calculator
Craig Bauling Purchasing Power Calculator
Fiona Maclachlan Monte Carlo Simulation of Retirement Savings with Variable Annual Return
Paul Savory (University of Nebraska-Lincoln)
-
 Dissolving Partnerships
Roger J. Brown -
 Forming the Efficient Frontier When Returns Are Non-Normal
Roger J. Brown -
 Spectral Measures
Roger J. Brown -
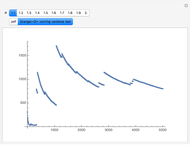 Granger-Orr Running Variance Test
Roger J. Brown -
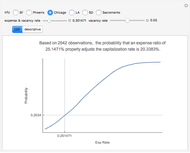 Capitalization Rate Probability
Roger J. Brown -
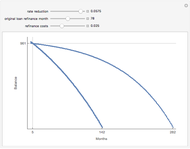
 Net Lease Economics
Roger J. Brown -
 The Refinance Decision
Roger J. Brown -
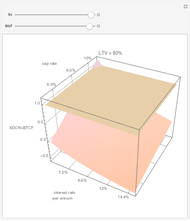
 True Cost of Variable Rate Mortgage Funds
Roger J. Brown -
Term Structure of Interest Rates
Roger J. Brown -
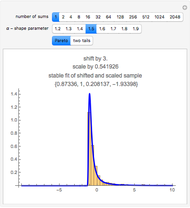 Generalized Central Limit Theorem
Roger J. Brown -
 Inflation-Adjusted Yield
Roger J. Brown -
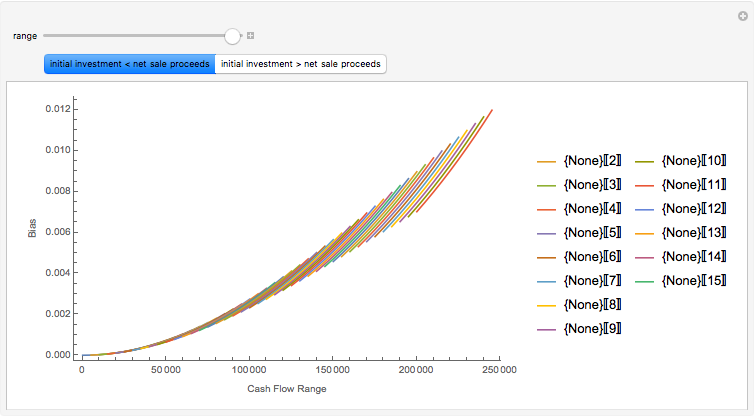 Simulating the IRR
Roger J. Brown -
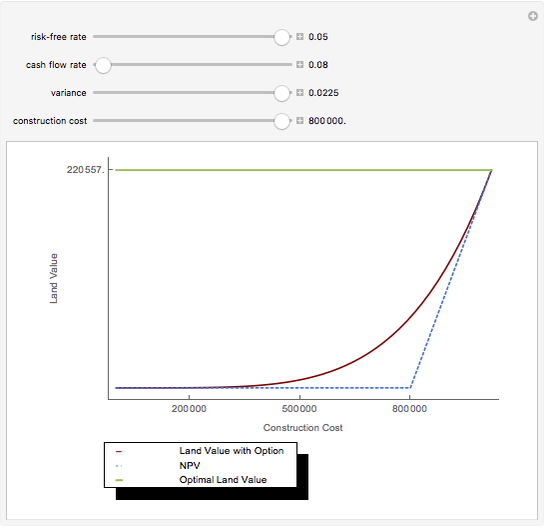 Real Options
Roger J. Brown -
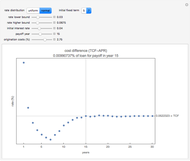
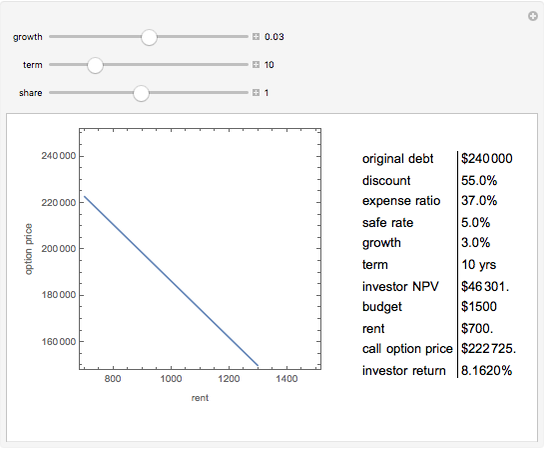
 The Price-Terms Tradeoff
Roger J. Brown -
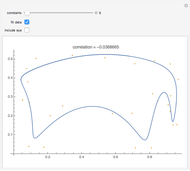 Fitting an Elephant
Roger J. Brown -
 Solving the Subprime Loan Problem
Roger J. Brown -
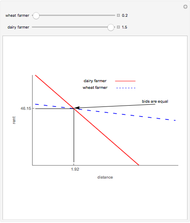 Why Location Matters: The Bid Rent Curve
Roger J. Brown -
 Explaining Real Estate Price Bubbles
Roger J. Brown -
 Value Added Growth Model
Roger J. Brown -
 Connecting the CDF and the PDF
Roger J. Brown