Iterative Polygon Simplification


Requires a Wolfram Notebook System
Interact on desktop, mobile and cloud with the free Wolfram Player or other Wolfram Language products.
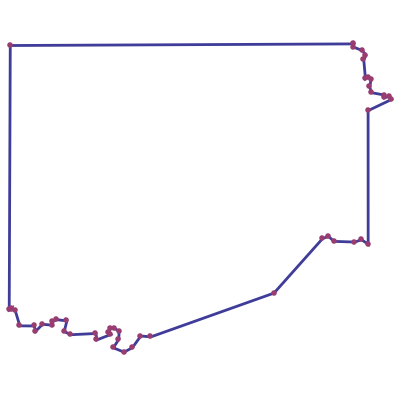
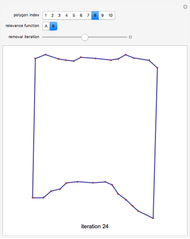
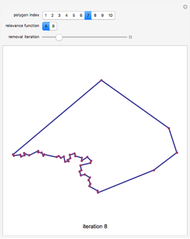
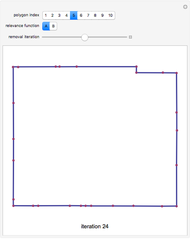
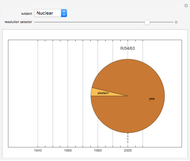
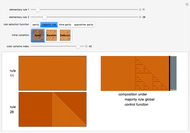
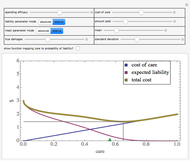
Polygons such as those created by geographic information systems are sometimes represented by data that is larger than necessary for relevant computations. This Demonstration shows how the representation of a polygon can be compressed. Although the compression is sometimes not lossless, for many practical purposes the shape or icon that results conveys adequate information for visualization, recognition, and computation. You select one of ten polygons that describe the shape of Texas counties using 50 points. You also select from two methodologies for determining the "relevance" of each vertex in the polygon. You can then drag the "removal iteration" slider to the right and see the least "relevant" points found by the selected method sequentially removed.
Contributed by: Seth J. Chandler (March 2011)
Open content licensed under CC BY-NC-SA
Snapshots


Details
"Method A" tends to result in more angular shapes than "method B", which tends to produce "curvier" shapes.
The algorithms used to determine the relevance of a vertex in a polygon are set forth and illustrated in D. J. Lee, S. Antani, and L. R. Long, "Similarity Measurement Using Polygon Curve Representation and Fourier Descriptors for Shape-Based Vertebral Image Retrieval," in Proceedings of SPIE--Volume 5032, Medical Imaging 2003: Image Processing (M. Sonka & J. M. Fitzpatrick, eds.), 2003 pp. 1283–1291.
The implementation of the simplification algorithm used in this Demonstration achieves needed speed by using the Mathematica compiler and by recognizing that most of the computed "relevance" values for each vertex are unaffected when a vertex is removed. Only the relevances of the neighboring vertices are potentially affected. Thus, the data structure used in this implementation stores a cache of computed relevance values and only computes new values when the removal of a vertex so requires. A compressed representation of the iterative simplification of the polygon is achieved by using an analogy to the GraphicsComplex command in Mathematica. The algorithm stores the coordinates of all the original points in the polygon, the currently active points, and the sequence of removed vertices. This data structure permits the Mathematica Fold or FoldList commands to readily reconstruct how a shape was simplified.
Permanent Citation
"Iterative Polygon Simplification"
http://demonstrations.wolfram.com/IterativePolygonSimplification/
Wolfram Demonstrations Project
Published: March 7 2011
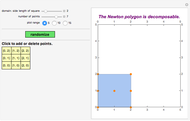 Decomposing a Random Newton Polygon
Kevin Choi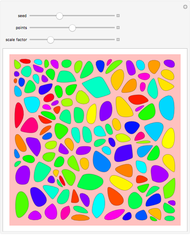 B-Spline Curves from Voronoi Polygon Vertices
Enrique Zeleny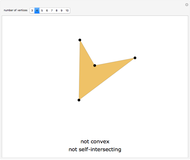 Testing a Polygon for Convexity and Self-Intersection
Jaime Rangel-Mondragon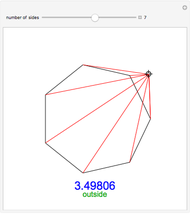 Is a Point Inside or Outside a Regular Polygon?
Jon Perry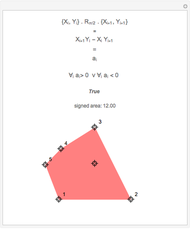 An Efficient Test for a Point to Be in a Convex Polygon
Robert Nowak Self-Intersecting Polygons
Stephen Wolfram Chains of Regular Polygons and Polyhedra
George Beck Fermat-Weber Point of a Polygonal Chain
Bhaswar B. Bhattacharya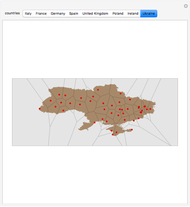 Voronoi Diagrams for European Cities
Trey Taylor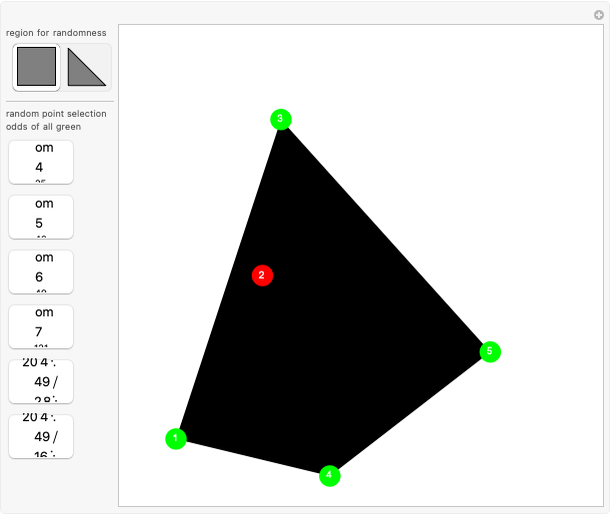 Sylvester's Four-Point Problem
Ed Pegg Jr
-
 Post-Event Bonding
Seth J. Chandler -
 Emulating Land Use Evolution with a Cellular Automaton
Seth J. Chandler -
 General Assembly Resolution Viewer
Seth J. Chandler -
 Random Acyclic Networks
Seth J. Chandler -
 A Theory of Insurance Lapses
Seth J. Chandler -
 Asylum in the United States
Seth J. Chandler -
 Property Coinsurance
Seth J. Chandler -
 The Persuasion Effect: A Traditional Two-Stage Jury Model
Seth J. Chandler -
 Cellular Automata with Global Control
Seth J. Chandler -
 Sports Seasons Based on Score Distributions
Seth J. Chandler -
 Evidentiary Uncertainty
Seth J. Chandler -
 Spectral Measures
Seth J. Chandler -
 The Banzhaf Power Index of States for Presidential Candidates
Seth J. Chandler -
 Liability Insurance Desirability under Lognormal Loss Distributions
Seth J. Chandler -
 The Effects of Coinsurance and Deductibles on Optimal Precautions for Weibull-Distributed Loss
Seth J. Chandler -
 Collocation by Chi Square
Seth J. Chandler -
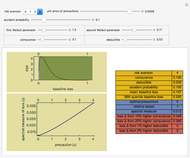
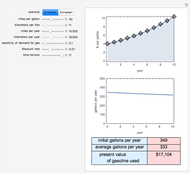 The Present Value of Future Gas Use
Seth J. Chandler -
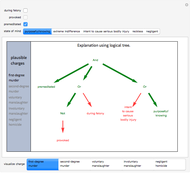 Visualizing Legal Rules: A Homicide Case
Seth J. Chandler -
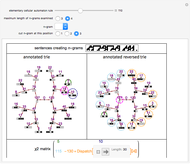
 Communities of Nations Bridged by Language Similarity
Seth J. Chandler