Kinematics of Traffic Congestion

Requires a Wolfram Notebook System
Interact on desktop, mobile and cloud with the free Wolfram Player or other Wolfram Language products.
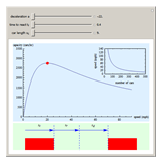
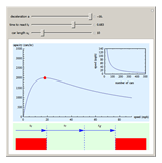
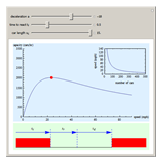
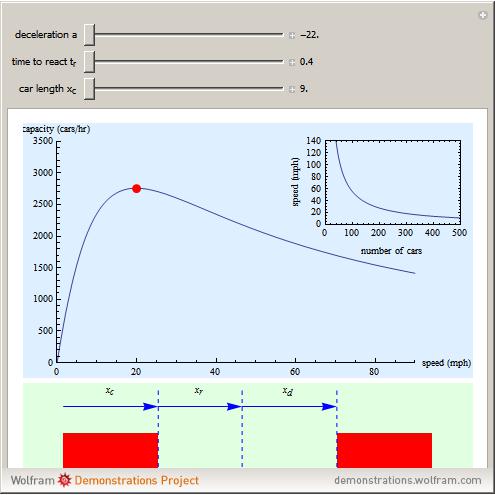
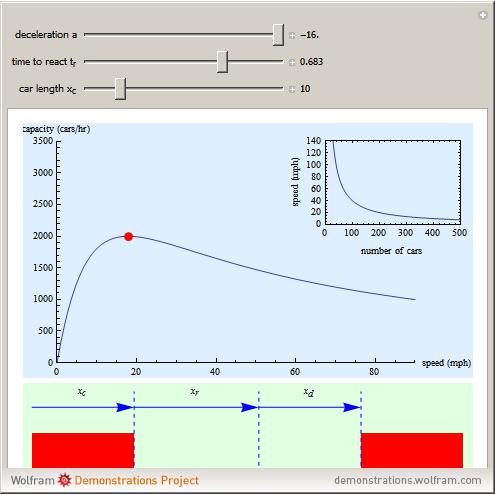
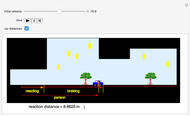
This simple model of traffic congestion on an expressway calculates the optimum speed for a given flow of vehicles. First the model calculates the stopping distance  , which is the sum of the length of the car
  , the distance that the car moves while the driver reacts
  , and the braking distance
  based on the deceleration.
Contributed by: Enrique Zeleny (March 2011)
Open content licensed under CC BY-NC-SA
Snapshots
Details
We are using basic formulas of kinematics  , where
  is the initial velocity, and
  . The capacity is defined as
  , where
  is the number of cars and
  is the stopping time. On the other hand,
  . It can be shown that
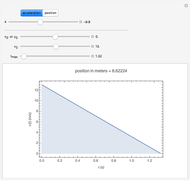
  , which is the function plotted.
Permanent Citation

