Kirchhoff Imaging

Requires a Wolfram Notebook System
Interact on desktop, mobile and cloud with the free Wolfram Player or other Wolfram Language products.
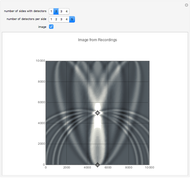
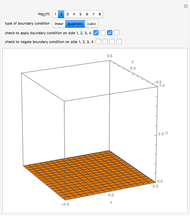
This Demonstration shows some simple cases of Kirchhoff imaging. A locatable point diffractor (red) is introduced as the perturbation to an otherwise homogeneous 2D medium, and a locatable point source (blue) is used for illumination. The result of the illumination is recorded at detectors placed along the edges of the square medium; their number per side and how many sides they are placed on is controllable by setters. Check the "image" box when ready to calculate. Uncheck to change the problem geometry.
Contributed by: David von Seggern (November 2012)
Nevada Seismological Laboratory
Open content licensed under CC BY-NC-SA
Snapshots
Details
The Kirchhoff method [2] of imaging applies to structures that cannot be directly sampled and characterized. It is a computationally efficient algorithm even for 3D problems. (It is also referred to as Born imaging; Radon imaging and backscatter imaging being similar methods.) This type of imaging projects the sampled recordings back onto grid points of the medium, using appropriate travel path times. It is applicable to any pattern of sources and detectors, with the computation time increasing as the product of their numbers. Assuming sampled recordings at multiple detectors have been made for a single source, the basic equation, somewhat simplified, for the Kirchhoff imaging strength A of a point  in the medium is given by:
 ,
,
where  is the effective signal velocity. The sum is taken over all detectors. In the case of multiple sources, a double sum is used to incorporate the additional sources. Consider the problem of a single point diffractor, as shown in this Demonstration. The illumination of the diffractor by a delta pulse causes a delta pulse to be recorded at the time equal to the source-to-diffractor time plus the diffractor-to-detector time. To do the imaging, the medium is represented by a uniform grid of points. By the imaging equation above, the diffractor point will have the maximum amplitude in the imaged medium because the pulses on the individual detector recordings coalesce at that point. In practice, the time function is never a delta function, and it is common to use a prescribed wavelet as the recorded signal in synthetic imaging. Here a symmetrical wavelet is used [1]; its time function is the third derivative of the error function. Its center frequency was set to 10 Hz. The exact image of the point diffractor is controlled by the wavelet shape and by the source and detector geometry. Many aliasing artifacts are possible; and for pulses that are not delta functions, the image at the diffractor is smeared even in the case of a large number of sources and detectors.
References
[1] N. Ricker, "The Form and Laws of Propagation of Seismic Wavelets," Geophysics, 18(10), 1953 pp. 10–40. doi:10.1190/1.1437843.
[2] Stanford Exploration Project, sepwww.stanford.edu/sep/prof/waves/krch/paper_html/node1.html.
Permanent Citation


