Logistic Model for Population Growth


Requires a Wolfram Notebook System
Interact on desktop, mobile and cloud with the free Wolfram Player or other Wolfram Language products.
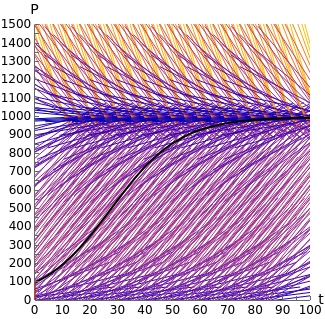
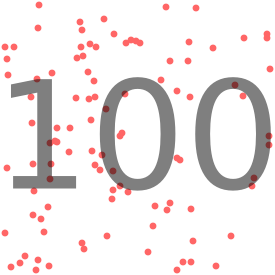
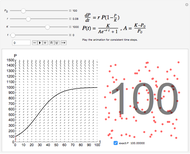
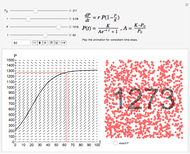
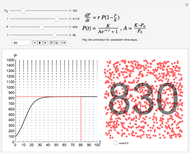
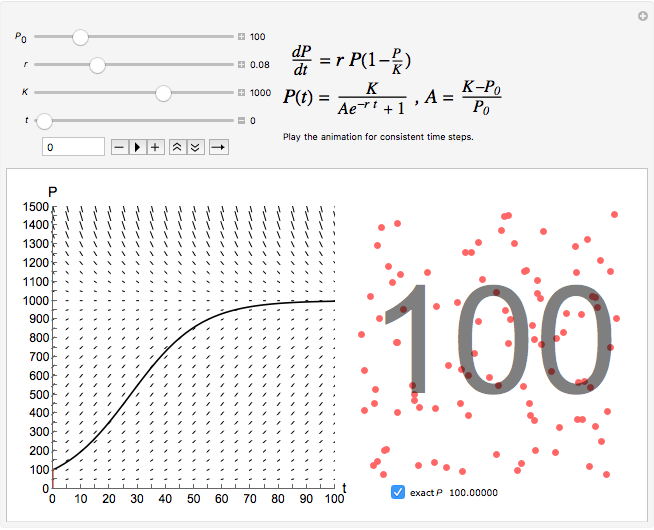
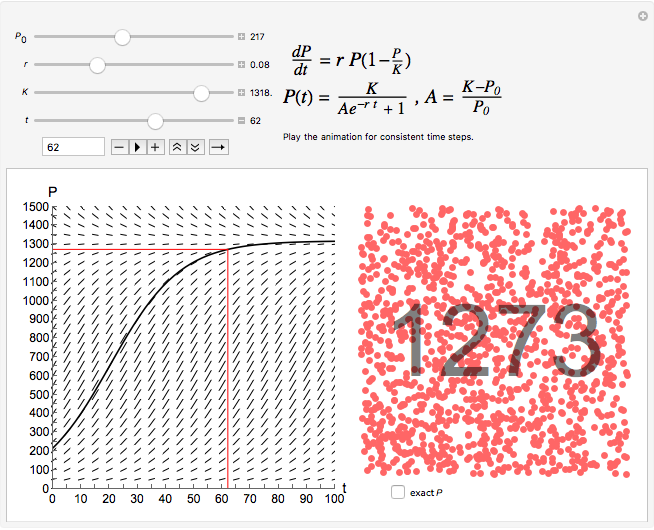
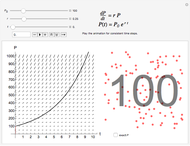
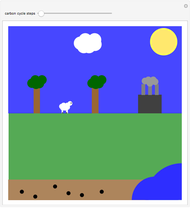
This Demonstration illustrates logistic population growth with graphs and a visual representation of the population. As time progresses, note the increase in the number of dots and how the rate of change increases but later decreases. Play the animation for  to see the behavior most clearly with discrete time steps. Compare this to exponential growth, presented in an analogous way in a companion Demonstration.
Contributed by: Abby Brown (January 2016)
Open content licensed under CC BY-NC-SA
Snapshots

Details
The logistic model for population as a function of time  is based on the differential equation
  , where you can vary
  and
and  , which describe the intrinsic rate of growth and the effects of environmental restraints, respectively. The solution of the logistic equation is given by
  , where
  and
and  is the initial population.
Permanent Citation
 Exponential Model for Population Growth
Abby Brown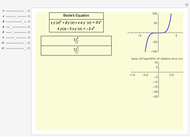 Boole Differential Equation with Continued Fractions
Andreas Lauschke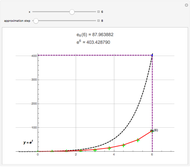 Euler's Method for the Exponential Function
Arnaud Crouzet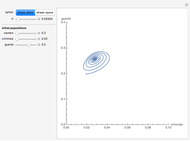 A Triangle Model of Criminality
Silvia Pierazzini and Juan C. Nuño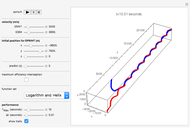 Intercepting ICBMs in Three Dimensions
Scott Constable Slope Fields
Charles E. Oelsner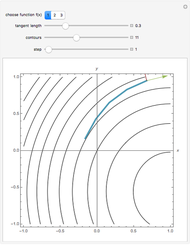 A Solution of Euler's Type for an Exact Differential Equation
Izidor Hafner Cauchy's Problem
Pablo Alberca Bjerregaard (University of Malaga, Spain)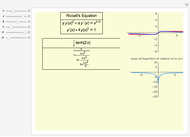 Riccati Differential Equation with Continued Fractions
Andreas Lauschke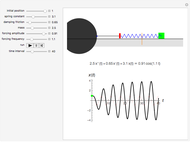 Driven Damped Oscillator
Mark Robertson-Tessi
-
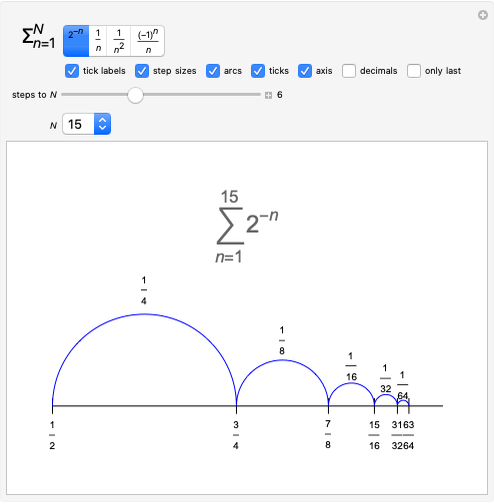 Series: Steps on a Number Line
Abby Brown -
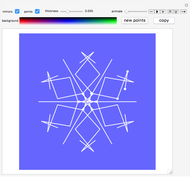 Snowflake Designs
Abby Brown -
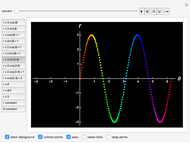 Morphing Cartesian to Polar Coordinates
Abby Brown -
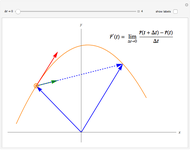 Derivative of a Vector-Valued Function in 2D
Abby Brown -
 Spinning Action
Abby Brown -
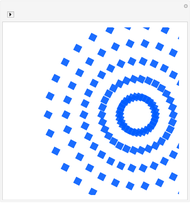 Fireworks with Regular Polygon and Circle Points
Abby Brown -
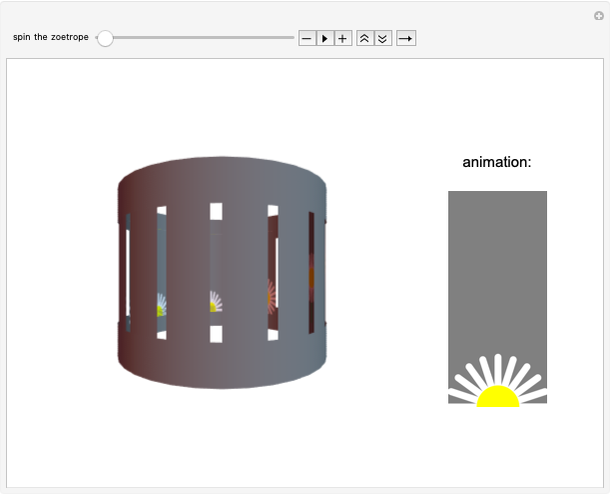 3D Zoetrope
Abby Brown -
 Color Gradient Sliders
Abby Brown -
 Logistic Model for Population Growth
Abby Brown -
Exponential Model for Population Growth
Abby Brown -
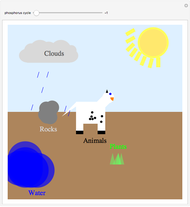 The Phosphorus Cycle
Abby Brown -
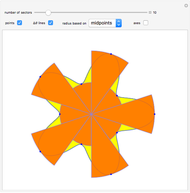 Approximating Polar Area with Sectors
Abby Brown -
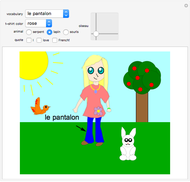 Let's Learn French! An Interactive Learning Game
Abby Brown -
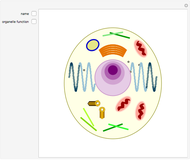 Animal Cell Structure
Abby Brown -
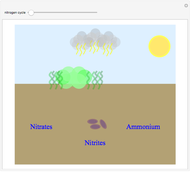 The Nitrogen Cycle
Abby Brown -
 The Carbon Cycle
Abby Brown -
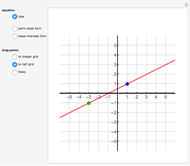 Lines: Two Points
Abby Brown -
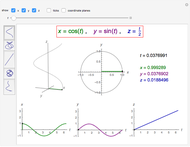 Parametric Curves in 3D
Abby Brown -
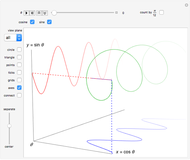 Sine and Cosine Helix
Abby Brown -
 Examples of Asymptotes in 2D and 3D
Abby Brown