Maps of a Complex Variable


Requires a Wolfram Notebook System
Interact on desktop, mobile and cloud with the free Wolfram Player or other Wolfram Language products.
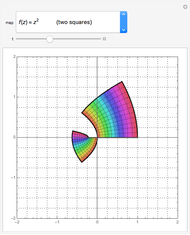
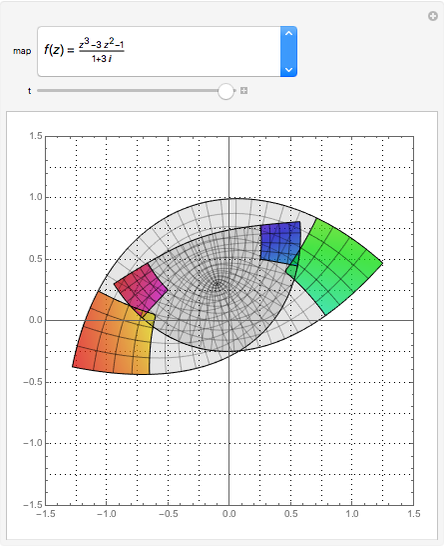
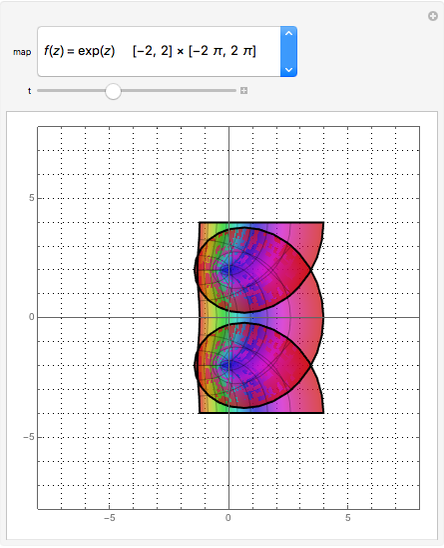
This Demonstration visualizes several complex maps by watching the range morph from the identity map to the desired result as the slider goes from 0 to 1. Part of the domain is colored (i.e., the map at  ) so that you can follow it visually as the plot evolves to the final map.
Contributed by: Douglas N. Arnold (March 2011)
Open content licensed under CC BY-NC-SA
Snapshots


Details
detailSectionParagraphPermanent Citation
"Maps of a Complex Variable"
http://demonstrations.wolfram.com/MapsOfAComplexVariable/
Wolfram Demonstrations Project
Published: March 7 2011
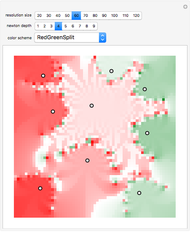 Complex Newton Map
Ed Pegg Jr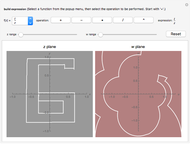 Complex Mapping of Contours and Regions
Ryan Keelty Smith (Wolfram Research)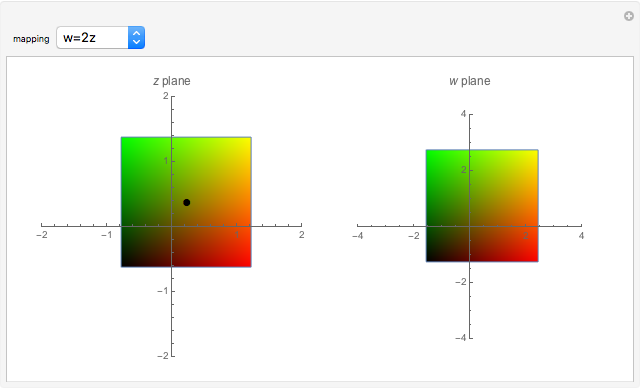 Mapping a Square by Complex Functions
Chris Boucher Complex Number
?tefan Porubský Complex Polynomials
Ed Pegg Jr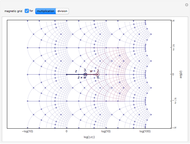 Complex Slide Rule
Michael Rogers (Oxford College of Emory University) The Complex Exponential
Leon Avery Complex Power Plot
Sue Hurley Powers of Complex Roots
Eliot Ball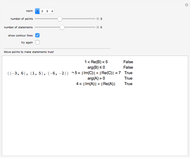 Complex Numbers with Different Norms
Izidor Hafner