Microlensing Light Curve for Stellar Objects


Requires a Wolfram Notebook System
Interact on desktop, mobile and cloud with the free Wolfram Player or other Wolfram Language products.
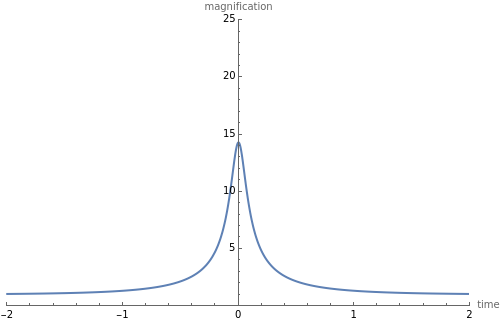
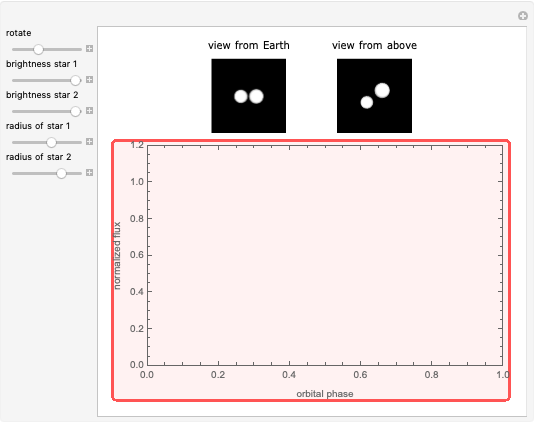
Gravitational microlensing is a phenomenon in which a compact, massive foreground object (the lens) bends the light of a background object (the source, such as a star or galaxy) so that multiple images of the source can be seen. If the source travels close enough to the lens in the sky, there is a chance of observing a microlensing event, during which the brightness of the source, and therefore of the entire system, increases for a brief period. This interactive graph shows the light curve of such an event, based on various parameters of the system.
Contributed by: Bryan Brzycki (October 2015)
Open content licensed under CC BY-NC-SA
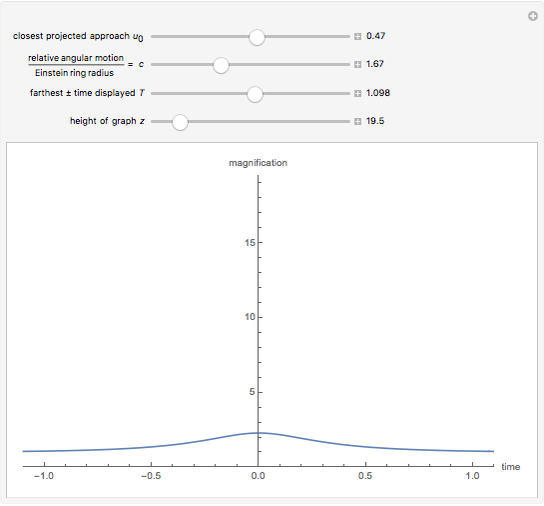
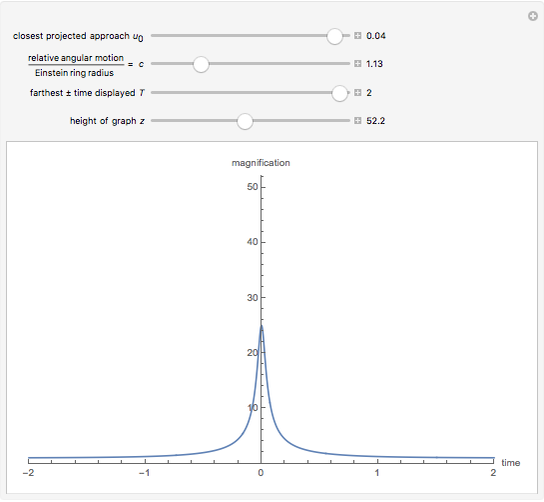
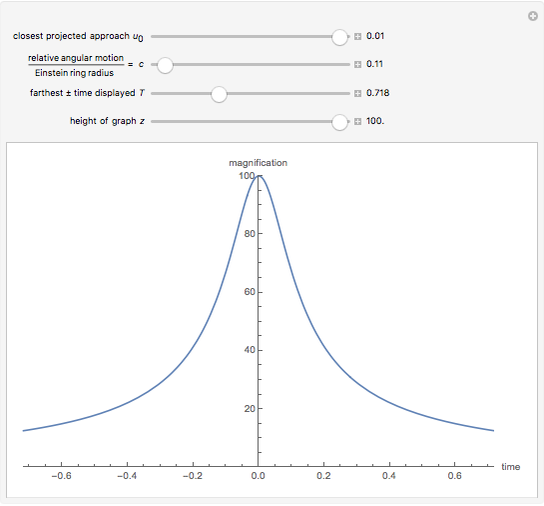
Snapshots
Details
The plot measures the change in brightness of the system as a function of time, where  is the time of closest (projected) approach between the lens and the source objects. Specifically,
  equals the magnification of the source brightness;
  is the original brightness.
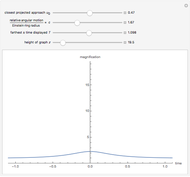
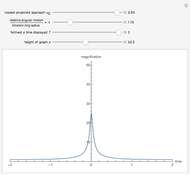
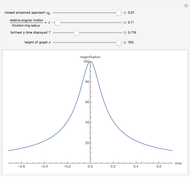
The quantity  is the closest projected approach in the sky of the source to the lens, and
  is the relative angular motion of the source divided by an angle termed the Einstein ring radius. The other two values control the bounds of the graph;
  is the farthest time displayed in the positive and negative directions, and
  is the height of the graph.
The Einstein ring radius  is defined to be the angular radius from the lens at which the image of the source would appear if the source and the lens were perfectly aligned along the line of sight. We define a function
  to be the angular distance between the source and the lens divided by (so that is dimensionless).
From the geometry of the situation, we can derive 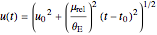 . But the magnification of the source brightness can be expressed as a function of , according to
  (see a longer explanation here). So, combining these expressions for
  and
and  to give magnification as a function of time, we get the plot shown in the graphic.
Note that we can define a natural timescale  , the time it takes the source to travel one Einstein radius, which makes
  . It turns out that the square of this timescale varies as the mass of the lens, and one can verify mathematically that increasing the mass of the lens ends up stretching the light curve horizontally. This effect can be seen by decreasing
  .
.
For some further reading, there is a broad overview of the math behind the light curve here.
References
[1] The Planetary Society. "Microlensing." (Oct 2, 2015) www.planetary.org/explore/space-topics/exoplanets/microlensing.html.
[2] P. Murdin, ed., "Microlensing," Encyclopedia of Astronomy and Astrophysics, Basingstoke, UK: Nature Publishing Group, 2001. www.astro.caltech.edu/~george/ay20/eaa-microlensing.pdf.
[3] Scholarpedia. "Microlensing Exoplanets." (Oct. 2, 2015) www.scholarpedia.org/article/Microlensing_exoplanets.
Permanent Citation
 Modeling Light Curves
Jeff Bryant Bending of Light by a Star
Chetiya Sahabandu Trajectory of a Test Mass in a Roche Potential
Ileyk El Mellah Tidal Forces
Tomas Franc Relativistic Effects on Satellite Clock as Seen from Earth
Jakub Serych Fitting an Ellipse to the Orbit of a Star near the Galactic Center
Weronika Lachtara and Jakub Bochinski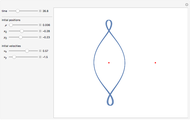 Restricted Three-Body Problem in a Plane
Enrique Zeleny Free Fall on the Solar System Planets and the Moon
Enrique Zeleny 3D Kerr Black Hole Orbits
David Saroff The Celestial Two-Body Problem
S. M. Blinder
