Model for the Formulation of Multilayered Emulsions

Requires a Wolfram Notebook System
Interact on desktop, mobile and cloud with the free Wolfram Player or other Wolfram Language products.
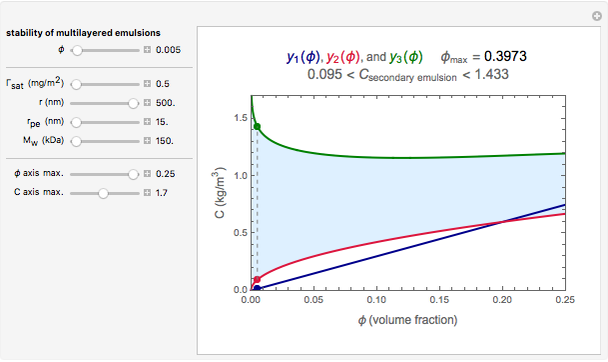
Biopolymers tend to form multilayered interfaces around oil droplets and stabilize oil-in-water emulsions. You can identify the maximum lipid concentration ( ) capable of forming a stable multilayer emulsion for a given biopolymer through theoretical calculations. The concentration range of the biopolymer can also be calculated. This Demonstration generates stability maps for multilayered emulsions based on the lipid fraction and the biopolymer properties (e.g. molecular weight,
  ) and concentrations. It depicts three functions that determine multilayer stability and identifies the range where stable emulsions can be formed.
Contributed by: Mark D. Normand, Uri Lesmes, and D. Julian McClements (March 2011)
Open content licensed under CC BY-NC-SA
Snapshots


Details
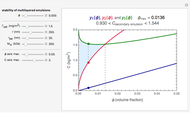
Snapshot 1: a stability map for a biopolymer having a molecular radius of 20 nm and of 200 kDa ("medium") coating lipid droplets with a radius of 250 nm at a surface load of 
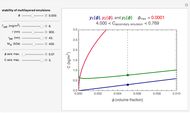
Snapshot 2: stability map for a biopolymer having a molecular radius of 40 nm and of 400 kDa ("large") coating lipid droplets with a radius of 300 nm at a surface load of 
Snapshot 3: stability map for a small surface active biopolymer with a molecular radius of 15 nm and of 150 kDa ("small") covering lipid droplets with a radius of 500 nm at a surface load of 
This Demonstration combines three equations to create the stability map. They calculate:
1. the characteristic saturation concentration, , which is the minimum biopolymer concentration required to fully saturate all the droplet surfaces.
  is calculated as
  , where
  is the lipid droplets’ volume fraction,
  is the surface load, and
  is the droplets’ mean radius.
2. the characteristic adsorption concentration,  , which is the minimum biopolymer concentration needed to ensure that its adsorption will occur faster than the droplets’ collisions. is calculated as
  , where
  is the biopolymer’s mean hydrodynamic radius.
3. the characteristic depletion concentration,  , which is the smallest biopolymer concentration where depletion flocculation is observed. is calculated through a series of nested equations as described and explained in [1] and [2].
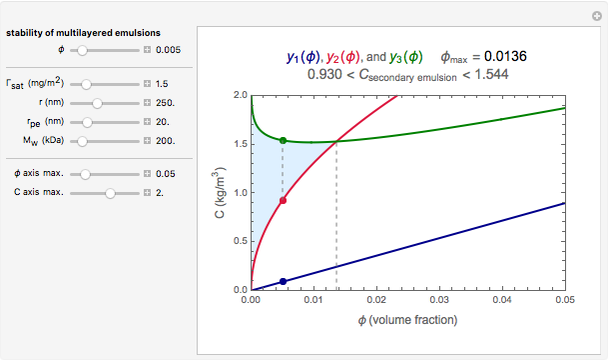
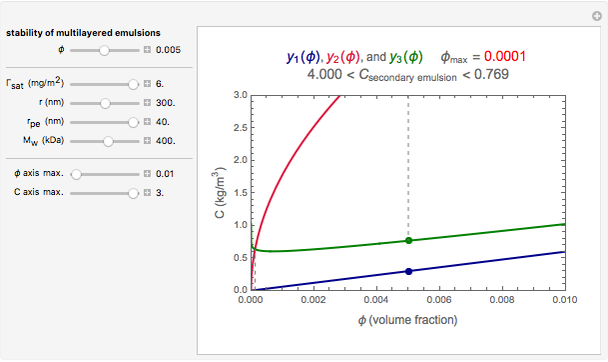
For a stable multilayered emulsion to be formed, the biopolymer concentration ought to be in a range whose lower bound is , shown as a red curve, and upper bound is , shown as a green curve. The light blue area between those curves defines the entire range of stable emulsions. The red, green, and blue dots mark the three function values for a particular volume, which you can enter with the slider.
The values of the three functions’ parameters, , , , and , are entered with sliders and so are the upper limits of the chart’s and  axes.
axes.
The equations to calculate and plot the chart are based on the assumption that any repulsive interactions between the biopolymer molecules and the emulsifier are negligible. They are used only for parameter ranges where the solutions have physical meaning.
References
[1] Y. H. Cho and D. J. McClements, "Theoretical Stability Maps for Guiding Preparation of Emulsions Stabilized by Protein-Polysaccharide Interfacial Complexes," Langmuir, 25(12), 2009 pp. 6649–6657.
[2] D. Guzey and D. J. McClements, "Formation, Stability and Properties of Multilayer Emulsions for Application in the Food Industry," Advances in Colloid and Interface Science, 128, 2006 pp. 227–248.
[3] D. J. McClements, "Design of Nano-Laminated Coatings to Control Bioavailability of Lipophilic Food Components," Journal of Food Science, 75(1), 2010 pp. R30–R42.
Permanent Citation
 Arrhenius versus Exponential Model for Chemical Reactions
Mark D. Normand and Micha Peleg Eyring-Polanyi versus Exponential Model for Chemical Reactions
Mark D. Normand, Christina S. Barsa, and Micha Peleg Brix Corrections for Citric Acid and Temperature
Mark D. Normand and Micha Peleg Idealized Conventional and Pressure-Assisted Thermal Preservation Processes
Mark D. Normand, Micha Peleg, and Murray Eisenberg Mass Balance of Binary Mixtures
Mark D. Normand and Micha Peleg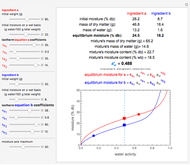 Equilibrium Water Activity of Binary Dry Mixtures
Mark D. Normand, Maria G. Corradini, and Micha Peleg Relaxation of a Discrete Maxwell Model
Mark D. Normand and Micha Peleg Probabilistic Model Showing Sigmoid Semilogarithmic Survival
Mark D. Normand, Micha Peleg, and Zack J. Rosenthal Simulating Microbial Count Records with an Expanded Fermi Solution Model
Mark D. Normand and Micha Peleg Weibullian versus Log-Linear Microbial Survival Models
Mark D. Normand and Micha Peleg