Nearest Neighbor Graph Connections

Requires a Wolfram Notebook System
Interact on desktop, mobile and cloud with the free Wolfram Player or other Wolfram Language products.
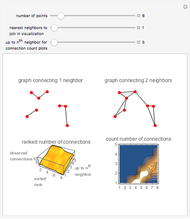
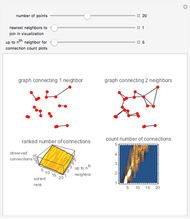
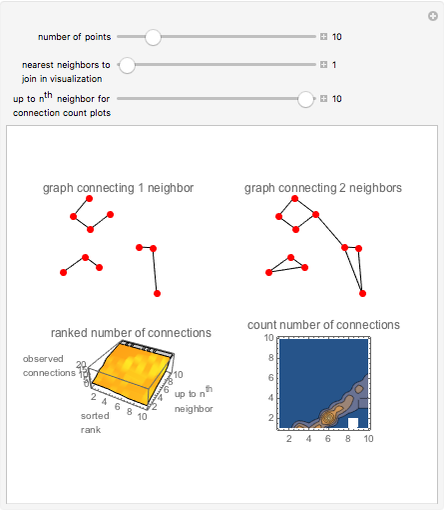
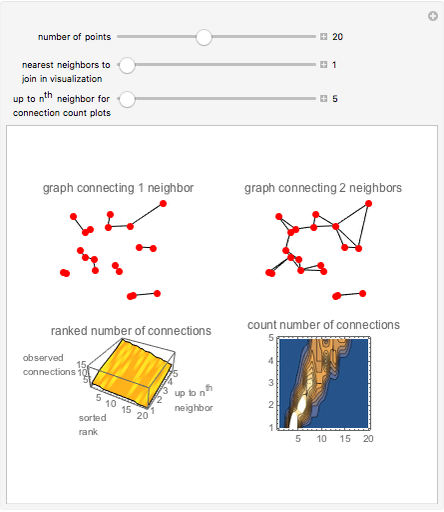
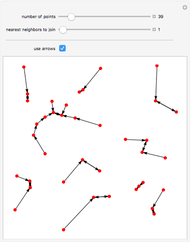
This Demonstration expands on a graphical study of nearest neighbors to look at the statistics of the number of connections. (The original Demonstration, "Nearest Neighbor Networks", looked at a process of connecting nearest neighbors and successively more removed neighbors on an assortment of points in 2D.) The parameter settings specify the number of connections to make from each point to its nearest neighbors and possibly to further neighbors. The first control is for the number of points. The second control is for the neighbor connections in the dot and stick visualization, while the third slider specifies the maximum of a range of neighbor connections over which to explore in the bottom plots. Note that while the parameter set specifies connections from each point to a certain number of neighbors, the result is more complex, with some points connected multiply as back-and-forth connections accumulate, so that clusters of connections form.
Contributed by: Jim Gerdy (March 2011)
Open content licensed under CC BY-NC-SA
Snapshots


Details
The two graphs at the top, from the original Demonstration, show an arrangement of points and connections for the number of neighbors specified and one number beyond.
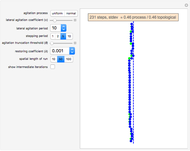
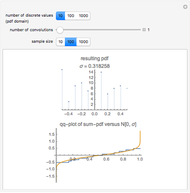
The bottom-left plot shows ranked plots over the range of neighbors chosen (up to the maximum). That is, for each value for nearest or next neighbors, the ranked graph shows how well the points are connected. As the number of specified neighbors increases, the number of realized connections increases as well. And there is a skew to the result, as a few dots have many connections and many dots are in the tail with fewer connections. Connections are concentrated as a purely probabilistic phenomenon.
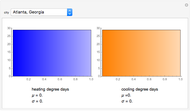
The contour plot at the lower right shows the statistics for the number of connections, a PDF in terms of counting the occurrences of different values for resulting connections. It uses the same results as in the ranked plot, but counts the occurrence of each value of connection. A ridge appears, representing the maximum count of connections for each nearest neighbor number. This ridge is more diffuse for larger values of connections as there is statistical variation in the clustering, with the larger reaches from successively farther neighbor connections. Finally both plots reach a maximum plateau at  connections. When enough neighbors are connected the points become connected to every other point.
Permanent Citation
"Nearest Neighbor Graph Connections"
http://demonstrations.wolfram.com/NearestNeighborGraphConnections/
Wolfram Demonstrations Project
Published: March 7 2011
 Nearest Neighbor Networks
Yifan Hu and Stephen Wolfram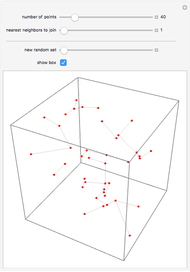 Random 3D Nearest Neighbor Networks
Yifan Hu and Stephen Wolfram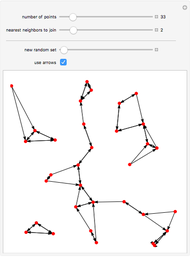 Random 2D Nearest Neighbor Networks
Yifan Hu and Stephen Wolfram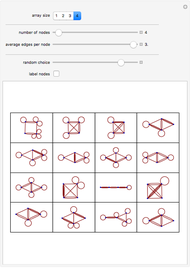 Samples of Random Graphs
Stephen Wolfram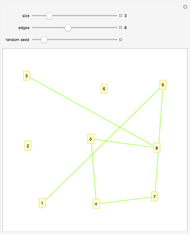 Connected Components
Ed Pegg and Daniel Lichtblau De Bruijn Graph Arcs
Michael Schreiber Nearest Hexagonal Positions
Michael Schreiber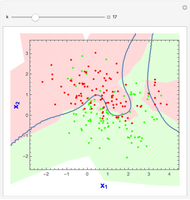 k-Nearest Neighbor (kNN) Classifier
Ian McLeod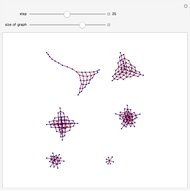 Graph Detangling
Yifan Hu and Stephen Wolfram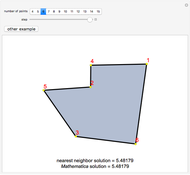 The Traveling Salesman Problem 3: Nearest Neighbor Heuristic
Jaime Rangel-Mondragon
-
 Exploration of Fluid Meandering by Statistical Simulation
Jim Gerdy -
 Cumulative Cooling and Heating Degree Days
Jim Gerdy -
 Histograms of Heating and Cooling Degree Days
Jim Gerdy -
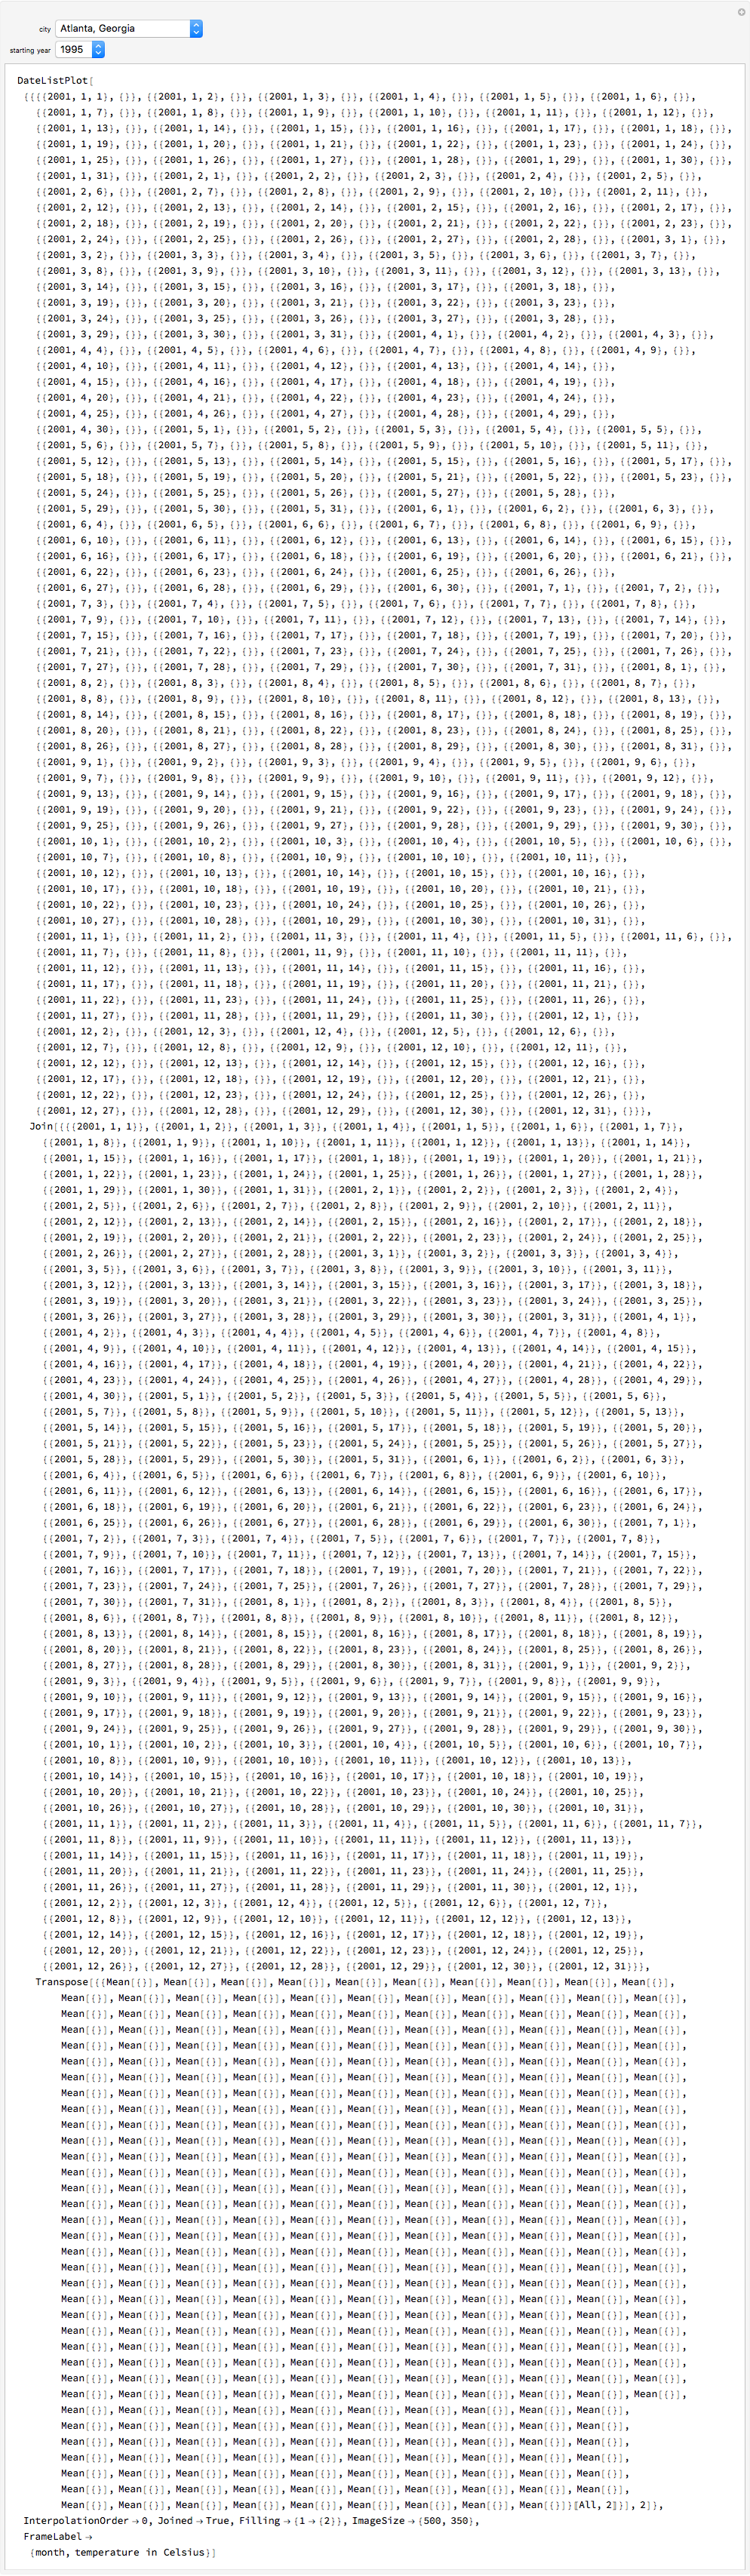 Annual Temperature Cycles
Jim Gerdy -
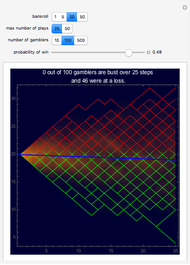 House Profits in Negative Edge Games
Jim Gerdy -
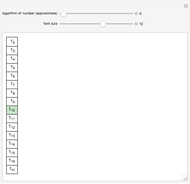 Factorial Number Base
Jim Gerdy -
 Nearest Neighbor Graph Connections
Jim Gerdy -
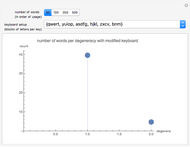 Efficacy of Degenerate Keyboard Maps
Jim Gerdy -
 Simulating a Normal Process from Sums of Uniform Distributions
Jim Gerdy -
 Cellular Automaton Rules on Dendrites
Jim Gerdy -
 The Broken Stick in n Dimensions
Jim Gerdy -
 Cellular Automaton Browser
Jim Gerdy -
 Random Partitioning of a List
Jim Gerdy