Pattern Recognition Primer


Requires a Wolfram Notebook System
Interact on desktop, mobile and cloud with the free Wolfram Player or other Wolfram Language products.
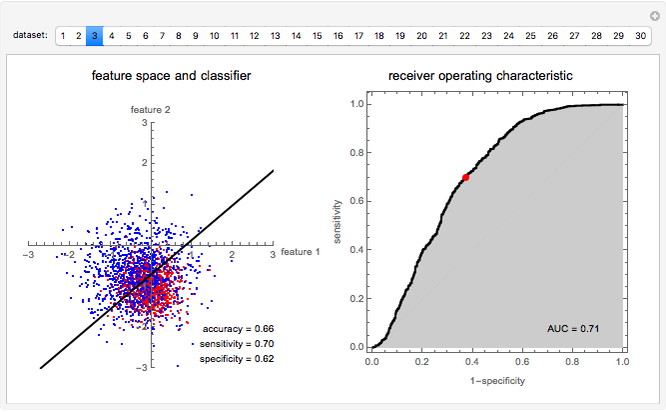
Pattern recognition algorithms are used to decide, for example, if a certain fish is salmon or sea bass, given the fish's width and lightness (Duda, 2000). Pattern recognition is the process of examining a pattern (e.g., the given width-lightness measurements) and assigning a class (e.g., salmon or sea bass) using a classifier (e.g., a rule based on the location of a graphical representation of the given sample with respect to other samples of the known class). Pattern recognition is used in diverse applications: handwriting recognition, financial analysis, gene expression, biometrics, and so on. A simple, yet applicable, example of a pattern recognition algorithm is the linear classifier. This is best understood by looking at two-dimensional examples in which patterns are represented as points and the classifier is represented as a straight line.
Contributed by: Shashi Sathyanarayana (March 2011)
Open content licensed under CC BY-NC-SA
Snapshots


Details
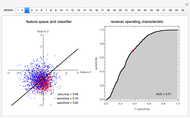
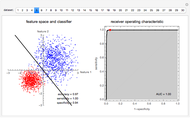
This Demonstration introduces basic pattern recognition principles. "Pattern recognition is the study of how machines can observe the environment, learn to distinguish patterns of interest from their background, and make sound and reasonable decisions about the categories of the patterns," (Jain, 2000). This Demonstration illustrates a simple supervised pattern recognition situation requiring the separation of the two classes represented by the red and blue dots, which we call the positives and the negatives, respectively. The coordinates specifying each pattern are called features. Patterns are also sometimes referred to as feature vectors.
The process of finding the best rule, in this case a straight line, to separate the given data is called training. Once trained and checked for accuracy, the linear classifier can assign an unseen sample to one of the predefined classes exemplified in the training set. It is important to evaluate the classifier to set reasonable expectations on its performance on unseen samples before its actual application.
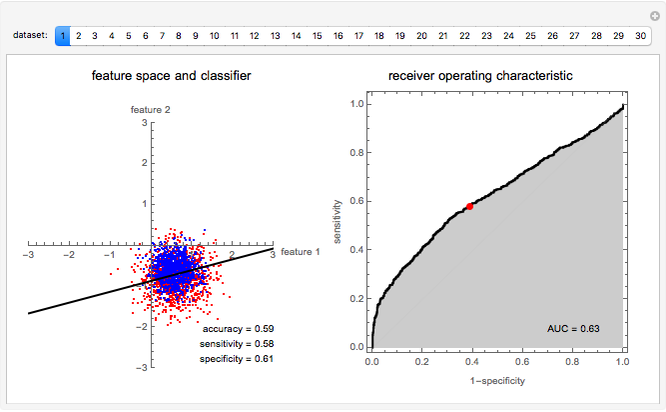
The simplest measure of performance is simply the percentage of training samples correctly classified. Two other important measures are the sensitivity and specificity. Sensitivity is the fraction of actually positive samples declared as positive by the classifier, while specificity is the fraction of actually negative samples declared as negative by the classifier. In many applications the cost of misclassifying class 1 as class 2 may have implications different from misclassifying class 2 as class 1. Indeed, it is possible to give up some of the sensitivity of recognizing class 1 for an increase in the sensitivity of recognizing class 2, and vice versa. For linear classifiers this simply means choosing a different line parallel to the original line.
The area under the receiver operating characteristic (ROC) curve is a measure of performance that is independent of where the parallel line is drawn. The ROC curve, in fact, contains information on accuracy attained for all possible parallel displacements of the separating line.
Use the buttons to choose different datasets and observe the performance of the linear classifier in separating the two classes.
This Demonstration has introduced supervised pattern recognition. For further information, see: A. K. Jain, R. P. W. Duin, and J. Mao, "Statistical Pattern Recognition: A Review," IEEE Transactions on Pattern Analysis and Machine Intelligence, 22(1), 2000 pp. 4-37. R. O. Duda , P. E. Hart, and D. G. Stork, Pattern Classification, New York: Wiley-Interscience, 2000.
Permanent Citation
 Pattern Recognition Primer II
Shashi Sathyanarayana Random Binary Differences
Michael Schreiber Blocks in Cellular Automaton Patterns
Stephen Wolfram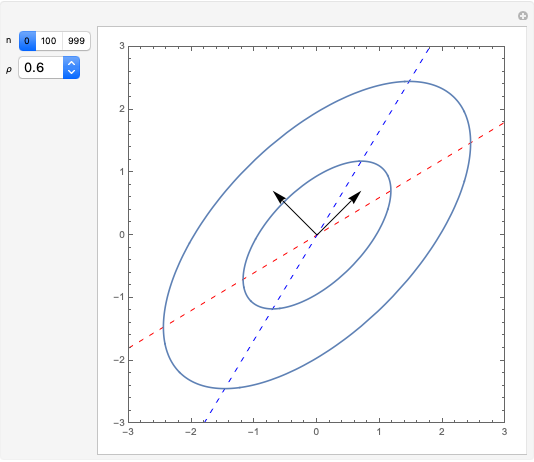 Karhunen-Loeve Directions and Regression
Ian McLeod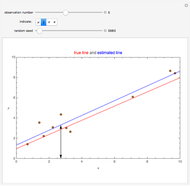 Mean, Fitted-Value, Error, and Residual in Simple Linear Regression
Ian McLeod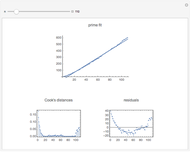 Fitting Primes to a Linear Model
Darren Glosemeyer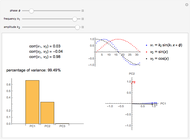 Loading Plot of a Principal Component Analysis (PCA)
D. Meliga and S. Z. Lavagnino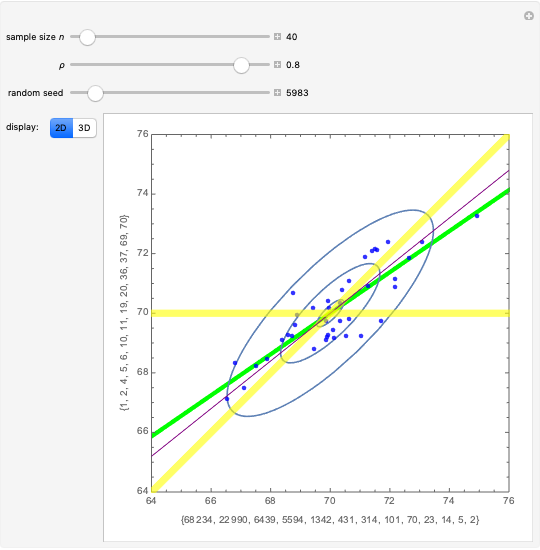 Regression toward the Mean
Ian McLeod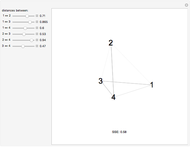 Multidimensional Scaling
Yaroslav Bulatov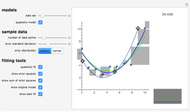 Linear and Quadratic Curve Fitting Practice
Jon McLoone