Pie Charts
Initializing live version


Requires a Wolfram Notebook System
Interact on desktop, mobile and cloud with the free Wolfram Player or other Wolfram Language products.
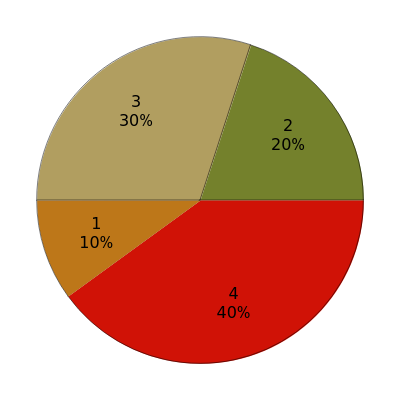
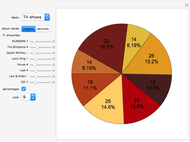
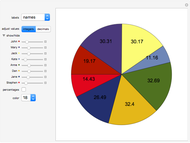
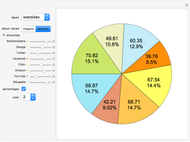
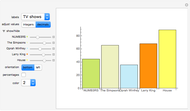
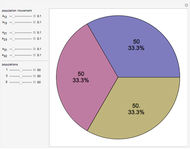
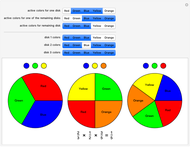
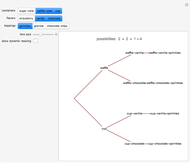
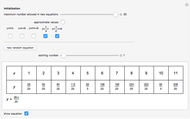
Pie charts are used to compare values of components as they relate to the whole of a dataset.
Contributed by: Jesse Nochella (March 2011)
Additional contributions by: Enrique Zeleny
Open content licensed under CC BY-NC-SA
Snapshots


Details
detailSectionParagraphPermanent Citation
"Pie Charts"
http://demonstrations.wolfram.com/PieCharts/
Wolfram Demonstrations Project
Published: March 7 2011
Related Demonstrations
More by Author
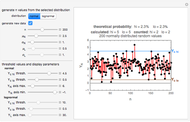 Failure Probabilities from Quality Control Charts
Mark D. Normand and Micha Peleg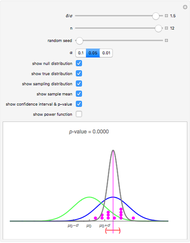 One-Sample t-Test and Confidence Interval with Dot Chart in Small Samples
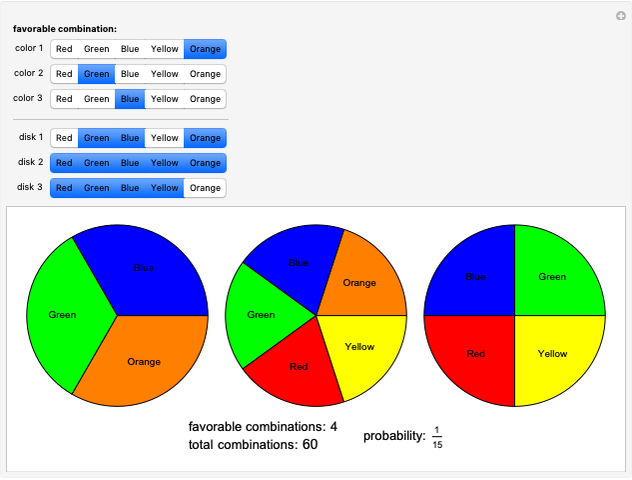
Douglas Woolford and Ian McLeod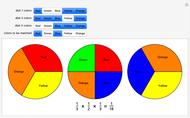 Probabilities of Matching Colors
Jesse Nochella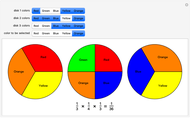 Multiplying Probabilities
Jesse Nochella Word Clouds
Enrique Zeleny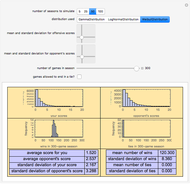 Sports Seasons Based on Score Distributions
Seth J. Chandler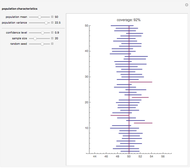 Confidence Intervals for a Mean
Chris Boucher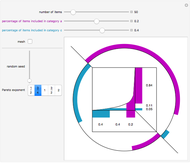 ABC Analysis
Michael Schreiber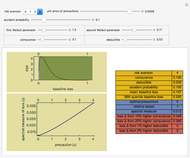 The Effects of Coinsurance and Deductibles on Optimal Precautions for Weibull-Distributed Loss
Seth J. Chandler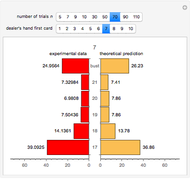 Dealer's Odds in Blackjack
D. Meliga and S. Z. Lavagnino
-
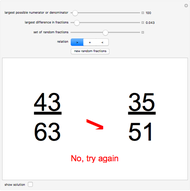 Comparing Fractions
Jesse Nochella -
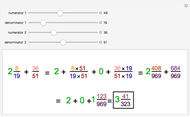
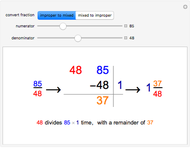 Mixed and Improper Fractions
Jesse Nochella -
 Cupid's Arrow
Jesse Nochella -
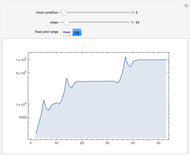 The Function Computed by the Wolfram 2,3 Turing Machine
Jesse Nochella -
 Simple Bar Chart
Jesse Nochella -
 Pie Charts
Jesse Nochella -
 Movement between Three Populations in a Closed System
Jesse Nochella -
Probabilities of Matching Colors
Jesse Nochella -
 Probabilities of Permutations
Jesse Nochella -
 Expanding a Set of Possibilities
Jesse Nochella -
 Probabilities of Combinations
Jesse Nochella -
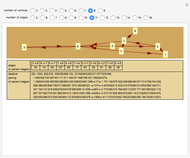 Enumerating the Directed Graphs
Jesse Nochella -
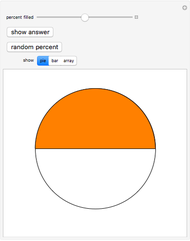 Estimating Percentages
Jesse Nochella -
Multiplying Probabilities
Jesse Nochella -
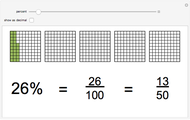 Percents as Fractions or Decimals
Jesse Nochella -
 Finding a Pattern (Linear Equations)
Jesse Nochella -
 Adding Mixed Numbers
Jesse Nochella -
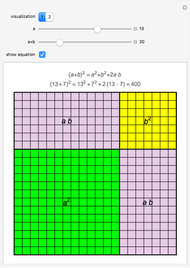 Squaring a Binomial
Jesse Nochella -
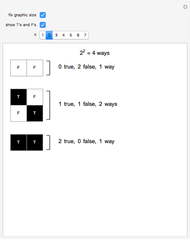 Number of Ways to Complete a True/False Test
Jesse Nochella -
 Place Value
Jesse Nochella