Plotting Vector-Valued Functions

Requires a Wolfram Notebook System
Interact on desktop, mobile and cloud with the free Wolfram Player or other Wolfram Language products.
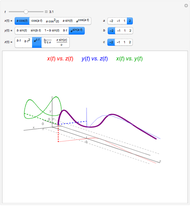
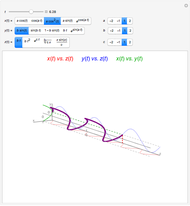
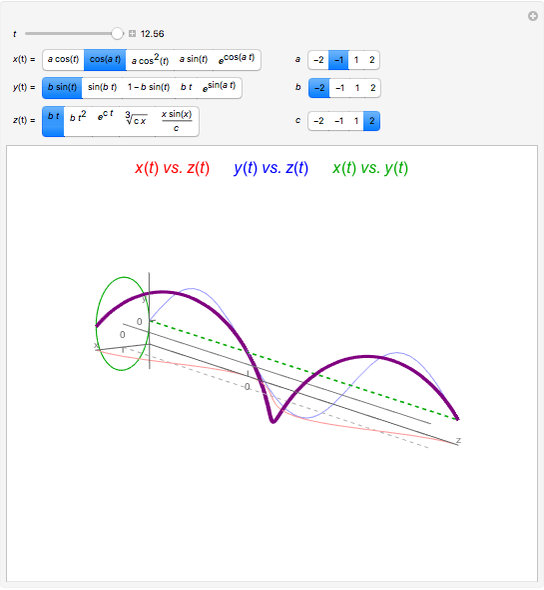
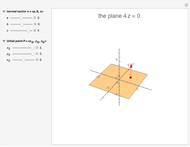
One way to represent a vector-valued function is to graph the parametric plot for  ,
,  on the
 plane, the parametric plot for
  ,
,  on the
 plane, and the parametric plot for
  ,
,  on the
 plane. The graph of the vector-valued function
  then shows each of these parametric plots as their orthogonal projections onto each of the coordinate planes.
Contributed by: Laura R Lynch (March 2016)
Open content licensed under CC BY-NC-SA
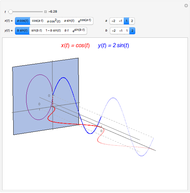
Snapshots


Details
detailSectionParagraphPermanent Citation
"Plotting Vector-Valued Functions"
http://demonstrations.wolfram.com/PlottingVectorValuedFunctions/
Wolfram Demonstrations Project
Published: March 21 2016
 Parametric Plots from Rectangular Plots
Laura R Lynch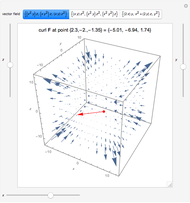 Curl of Some Vector Fields
Ryan Zhan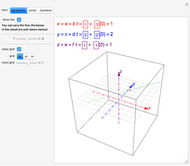 Lines in 3D Space (Parametric, Vector, and Cartesian Forms)
Sergio Hannibal Mejia, Alexander Papen, Guilherme Raposo Pereira Mansur, and Arisa Yoshikawa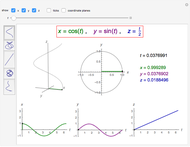 Parametric Curves in 3D
Abby Brown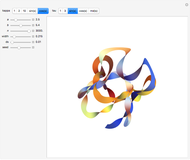 Intrinsic 3D Curves
Enrique Zeleny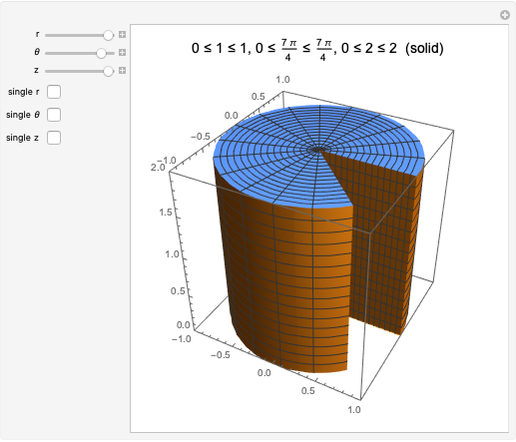 Exploring Cylindrical Coordinates
Faisal Mohamed A Wavy Parametric Cliff Overlooking the Sea
Pablo Fernández Ruiz de Alba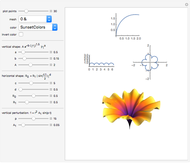 Virtual Flowers with Crispate Petals
János Karsai (University of Szeged)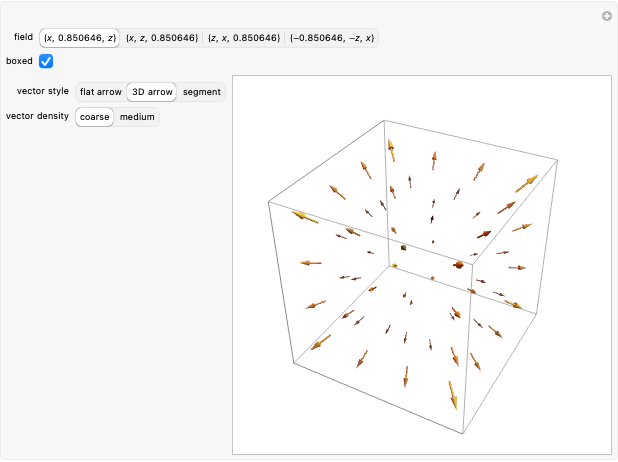 3D Vector Fields
Gosia Konwerska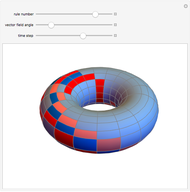 Cellular-Automaton-Like Neural Network in a Toroidal Vector Field
Benjamin I. Rapoport
-
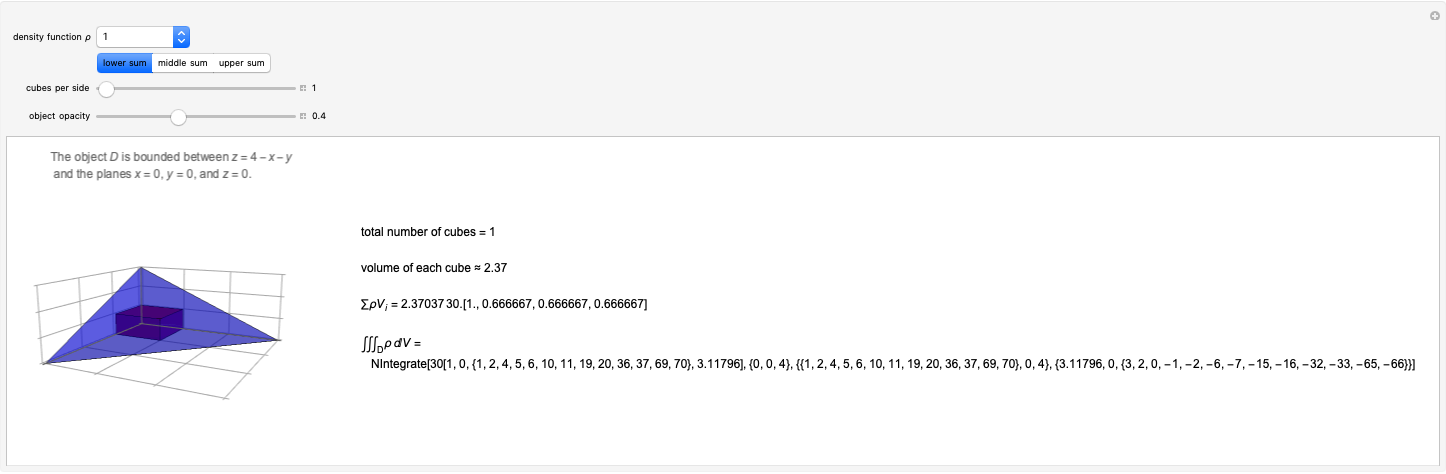 Some Triple Integrals for Mass
Laura R. Lynch -
Parametric Plots from Rectangular Plots
Laura R. Lynch -
 Plotting Vector-Valued Functions
Laura R. Lynch -
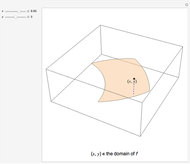 Domain of a Function of Two Variables
Laura R. Lynch -
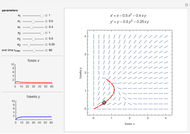 Competing Species Model with Two Species
Laura R. Lynch -
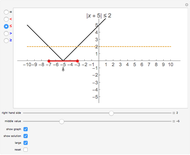 Number Line Solutions to Absolute Value Equations and Inequalities
Laura R. Lynch -
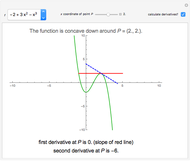 Understanding Concavity
Laura R. Lynch -
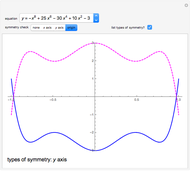 Symmetry in Graphs of Functions and Relations
Laura R. Lynch -
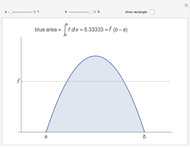 Average Value via Integrals
Laura R. Lynch -
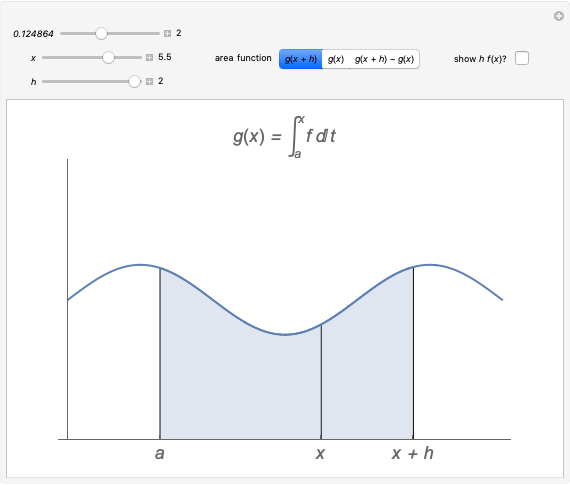 Intuition for the Fundamental Theorem of Calculus
Laura R. Lynch -
 Rolle's Theorem
Laura R. Lynch -
 Examples of Finding Asymptotes
Laura R. Lynch -
 Equation of a Plane
Laura R. Lynch -
 Graphs of Exponential Functions
Laura R. Lynch -
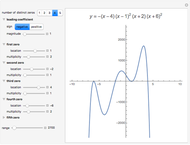 Zeros and Multiplicities of Factored Polynomials
Laura R. Lynch -
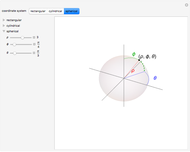 Three-Dimensional Coordinate Systems
Laura R. Lynch -
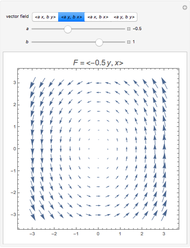 Four Introductory Examples of Two-Dimensional Vector Fields
Laura R. Lynch -
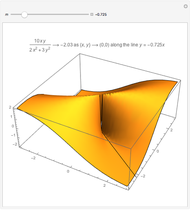 Nonexistence of a Multivariable Limit
Laura R. Lynch -
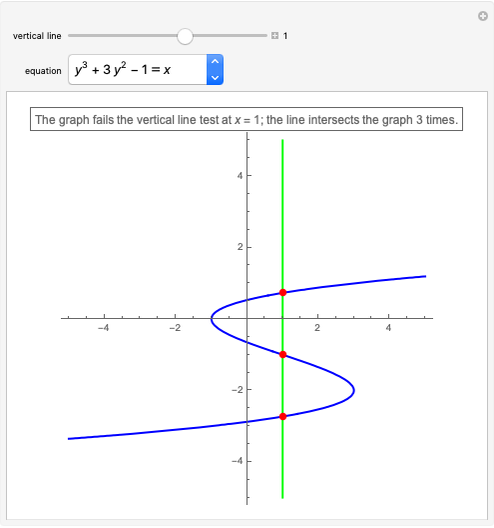 Vertical Line Test
Laura R. Lynch