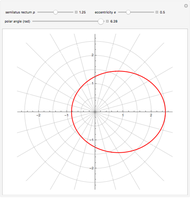
Polar Plots of Conic Sections

Requires a Wolfram Notebook System
Interact on desktop, mobile and cloud with the free Wolfram Player or other Wolfram Language products.
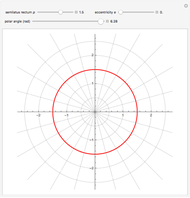
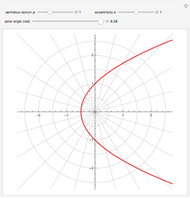
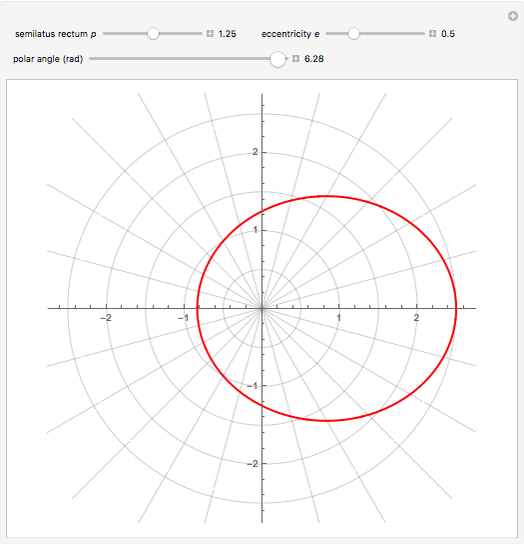
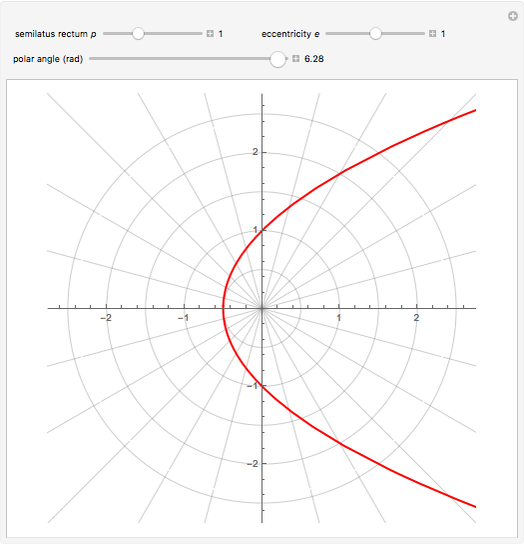
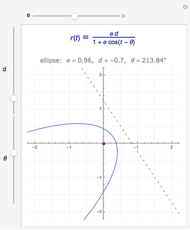
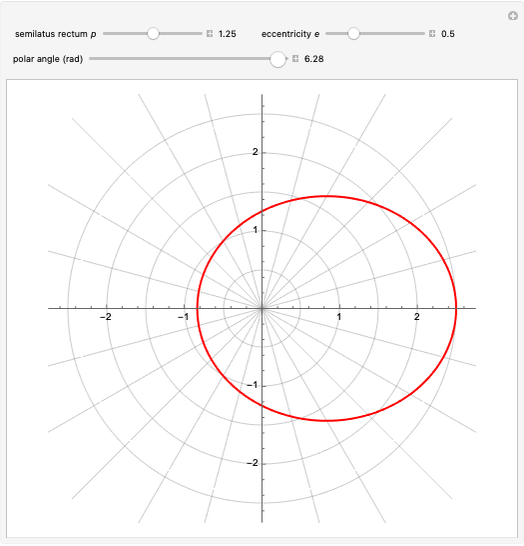
Conic sections (the circle, ellipse, parabola and hyperbola) can all be represented by an equation in polar coordinates:
[more]


Contributed by: S. M. Blinder (November 2019)
Open content licensed under CC BY-NC-SA
Details
A more general form for the polar equation is
 ,
,
where one focus is at the left-hand side of the conic for the minus sign (which we have used) but on the right-hand side of the conic for the plus sign. The alternative form

rotates the conics by 90°, with the semimajor axis oriented vertically.
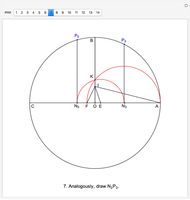
The following illustration shows the derivation of the formula for the case of a parabola ( ), with the focus at
  and the directrix (the vertical line) on the left.
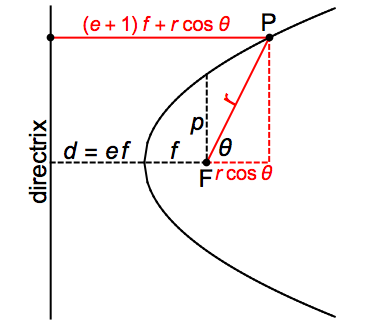
At every point  on the curve, the defining relation is
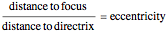 or
or 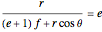 .
.
The semilatus rectum  is equal to
  when
when  . We obtain thereby
 .
.
Snapshots

Permanent Citation
 Conic Sections: Polar Equations
Abby Brown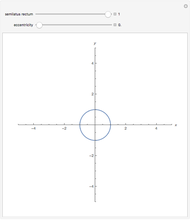 Conic Section
Roberto Contrisciani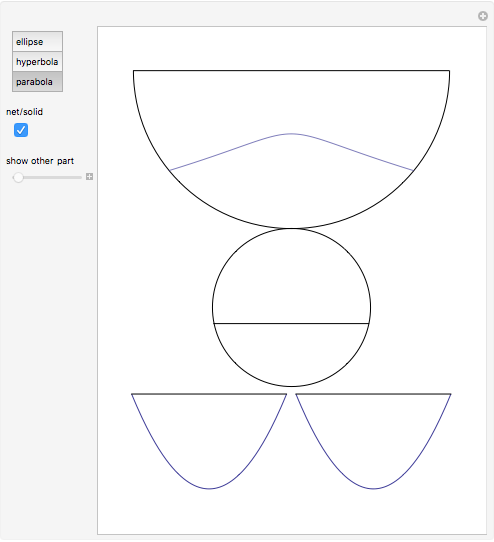 Paper Model of Conic Sections
Izidor Hafner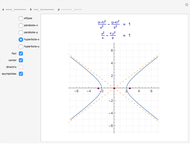 Conic Sections: Equations and Graphs
Kelly Deckelman, Kathleen Feltz, Jenn Mount Conic Sections: The Double Cone
Phil Ramsden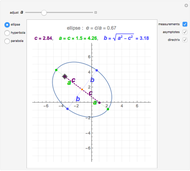 Conic Sections: Move Foci
Abby Brown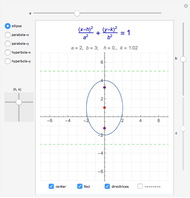 Conic Section Curves
Abby Brown Conic Section as Bézier Curve
Isabelle Cattiaux-Huillard and Gudrun Albrecht Elliptical Conic Section Using Dandelin Spheres
Sungkon Chang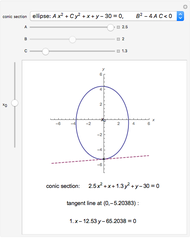 Tangent Lines to a Conic Section
Soledad María Sáez Martínez and Félix Martínez de la Rosa
-
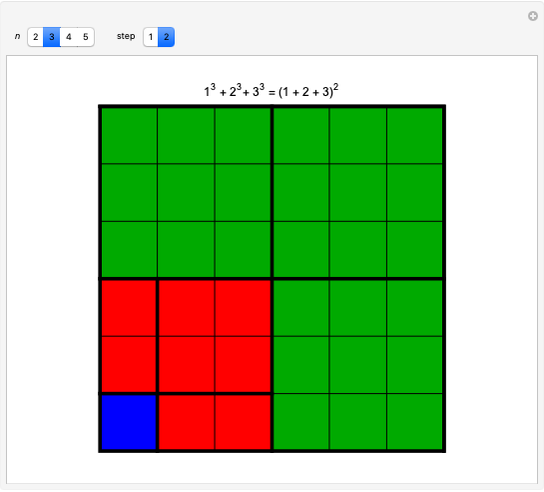 Fry's Geometric Demonstration of the Sum of Cubes
S. M. Blinder -
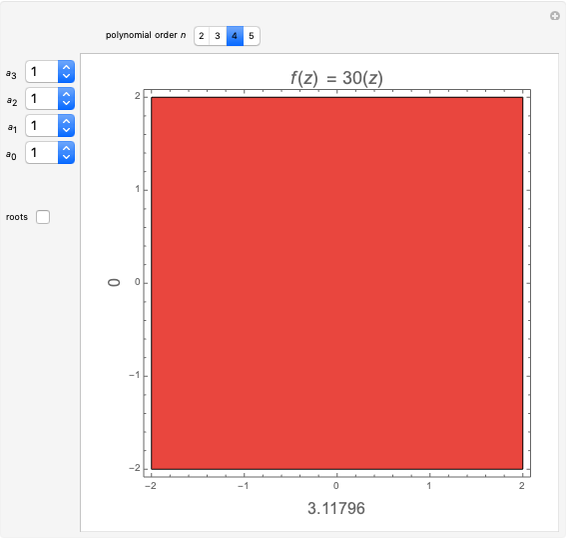 Polynomials in the Complex Plane
S. M. Blinder -
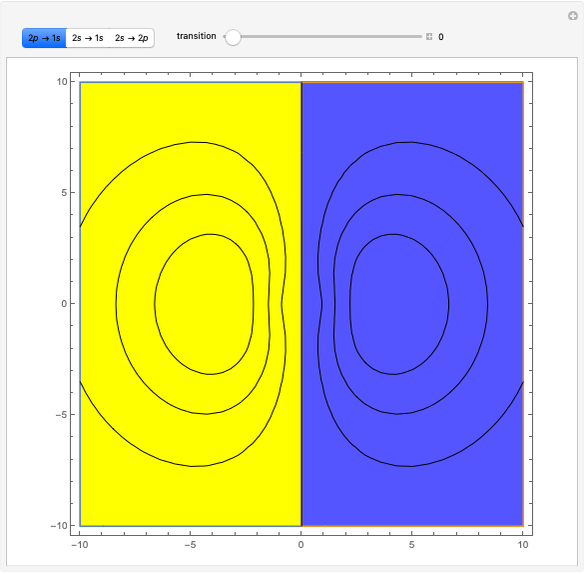 Anatomy of a Quantum Jump
S. M. Blinder -
 Polar Plots of Conic Sections
S. M. Blinder -
 De La Hire's Construction of an Ellipse
S. M. Blinder -
 Hodographs for Kepler Orbits
S. M. Blinder -
 Polarizability of Hydrogen Atoms
S. M. Blinder -
 Solutions of Schrödinger Equation for a Particle in a Finite Spherical Well
S. M. Blinder -
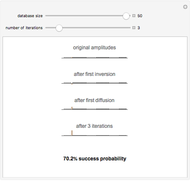 Simulated Quantum Computer Algorithm for Database Searching
S. M. Blinder -
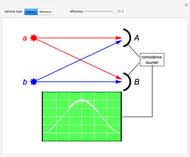 Hanbury Brown and Twiss Interference for Bosons and Fermions
S. M. Blinder -
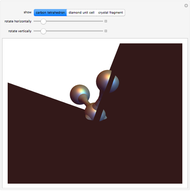 The Structure of Diamond
S. M. Blinder -
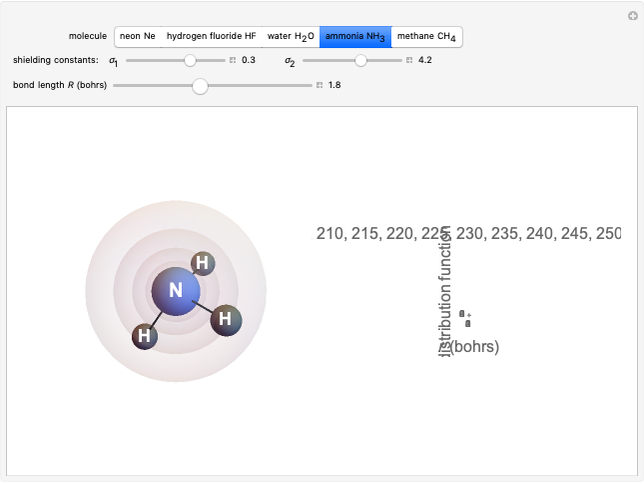 Hydrides as Isoelectronic Perturbations of the Neon Atom
S. M. Blinder -
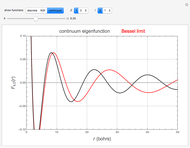 Zero-Energy Limit of Coulomb Wavefunctions
S. M. Blinder -
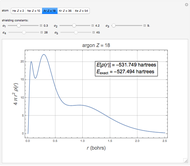 Density Functional Computations on Noble Gas Atoms
S. M. Blinder -
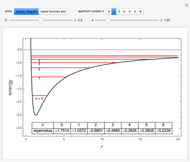 Exact Solutions of the Schrödinger Equation for the Kratzer Potential
S. M. Blinder -
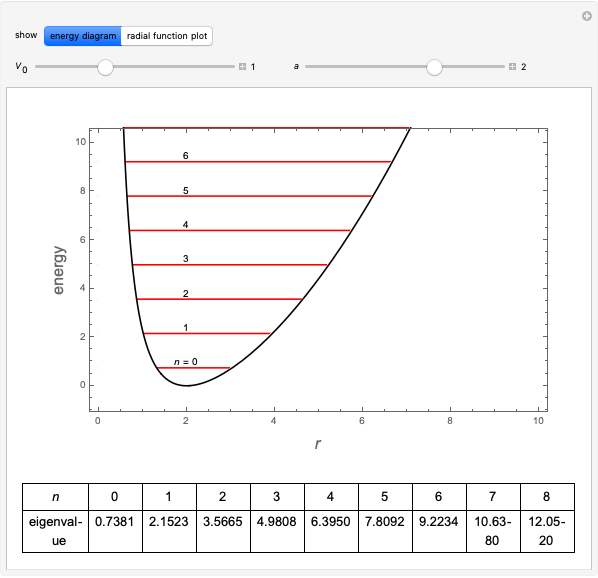 Exact Solutions of the Schrödinger Equation for Pseudoharmonic Potential
S. M. Blinder -
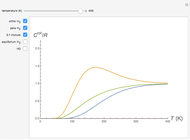 Low-Temperature Heat Capacity of Hydrogen Molecules
S. M. Blinder -
 Constructing a Regular Heptadecagon (17-gon) with Ruler and Compass
S. M. Blinder -
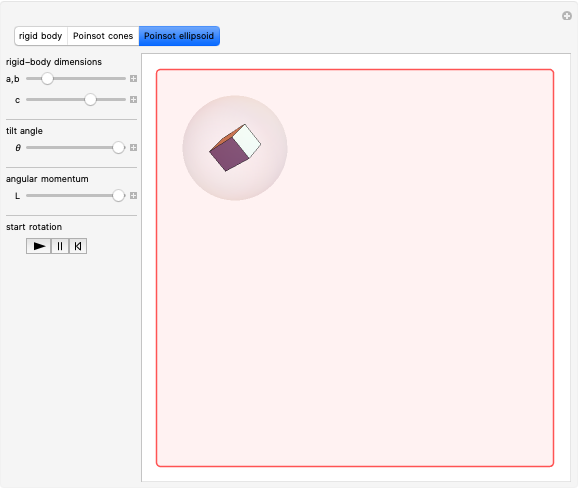 Free Rotation of a Rigid Body: Poinsot Constructions
S. M. Blinder -
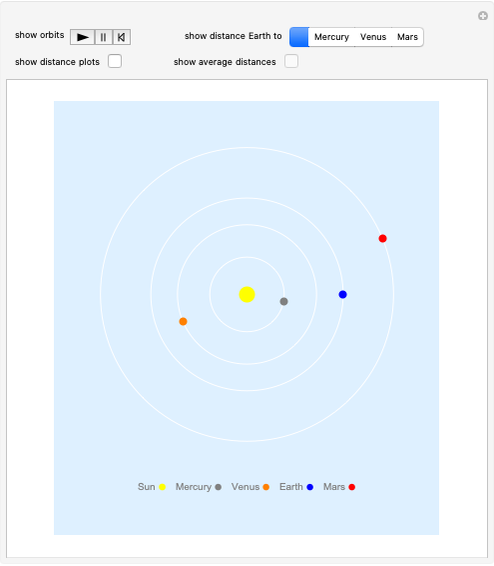 Venus Is Not the Earth's Closest Planetary Neighbor
S. M. Blinder