Principal Components

Requires a Wolfram Notebook System
Interact on desktop, mobile and cloud with the free Wolfram Player or other Wolfram Language products.
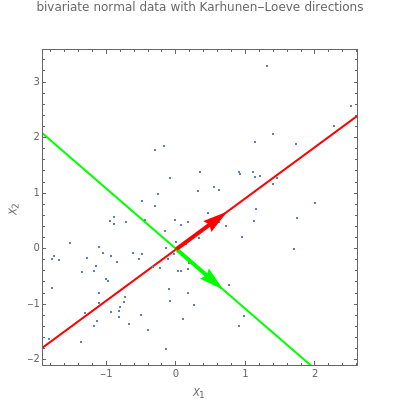
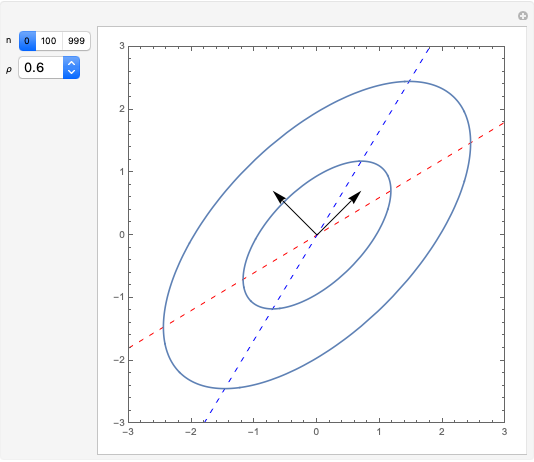
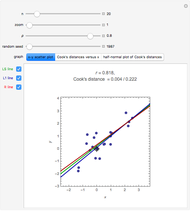
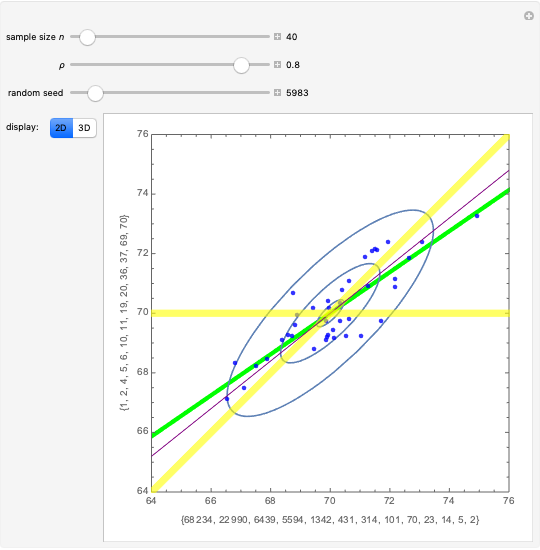
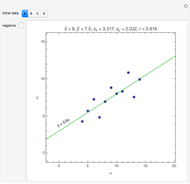
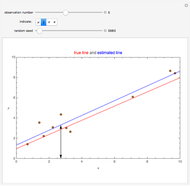
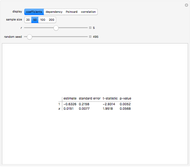
The construction of principal components is illustrated. This Demonstration considers the case for two variables  and
and  that are simulated as multivariate normal with zero means, unit variances, and theoretical correlation
  . The sample size
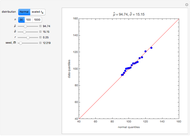
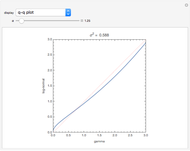
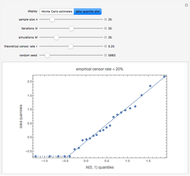
  can be 10, 100, or 999, and there are three graphs.
Contributed by: Ian McLeod (March 2011)
Open content licensed under CC BY-NC-SA
Snapshots
Details
I. T. Jolliffe, Principal Component Analysis, 2nd ed., New York: Springer, 2004.
T. Hastie, R. Tibshirani, and J. Friedman, The Elements of Statistical Learning: Data Mining, Inference, and Prediction, 2nd ed., New York: Springer, 2009.
Permanent Citation
