Projecting Graphs of Real-Valued Functions of a Real Variable to the Riemann Sphere

Requires a Wolfram Notebook System
Interact on desktop, mobile and cloud with the free Wolfram Player or other Wolfram Language products.
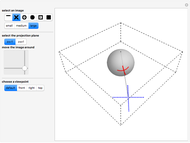
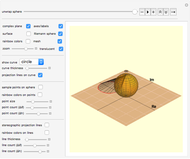
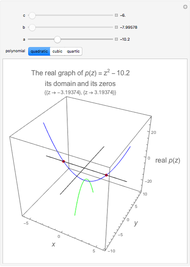
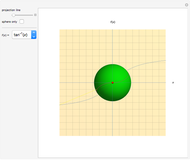
This Demonstration projects the graph of the real-valued function  (blue) to a curve (pink) on a Riemann sphere. The Riemann sphere's south pole is zero and its north pole is infinity; it is tangent at its south pole to the
  -
- plane at the origin. You can hide the plane and projection line from the graph to the curve with "sphere only".
Contributed by: Chris Dock (February 2013)
Open content licensed under CC BY-NC-SA
Snapshots
Details
Snapshot 1: projection of the graph of 
Snapshot 2: projection of the graph of 
Snapshot 3: projection of the graph of 
Snapshot 4: projection of the graph of 
Permanent Citation


