Ratkowski's Square Root Growth Rate Model for High Temperatures


Requires a Wolfram Notebook System
Interact on desktop, mobile and cloud with the free Wolfram Player or other Wolfram Language products.
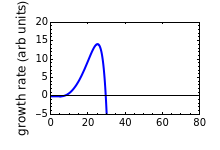
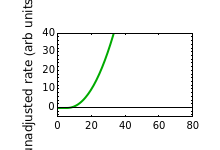
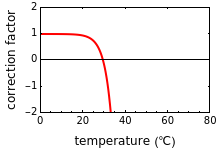
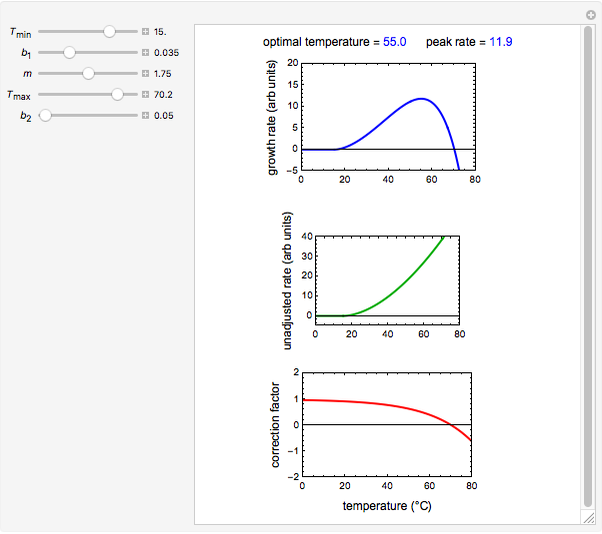
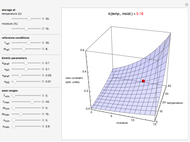
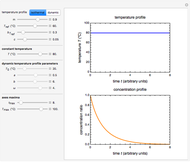
Microbial population growth has an optimal temperature characteristic of its type, beyond which the growth not only slows down but can turn into heat inactivation. The temperature effect on the growth rate at temperatures well below and above the optimal has been described by several modified versions of Ratkowski's square root model. This Demonstration provides graphical visualization of the output for the modified model, and shows plots of the superimposed correction factor. The optimal temperature and peak growth rate can be calculated from the five parameters.
Contributed by: Mark D. Normand and Micha Peleg (June 2018)
Open content licensed under CC BY-NC-SA
Snapshots
Details
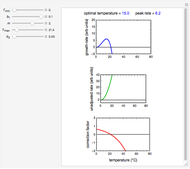
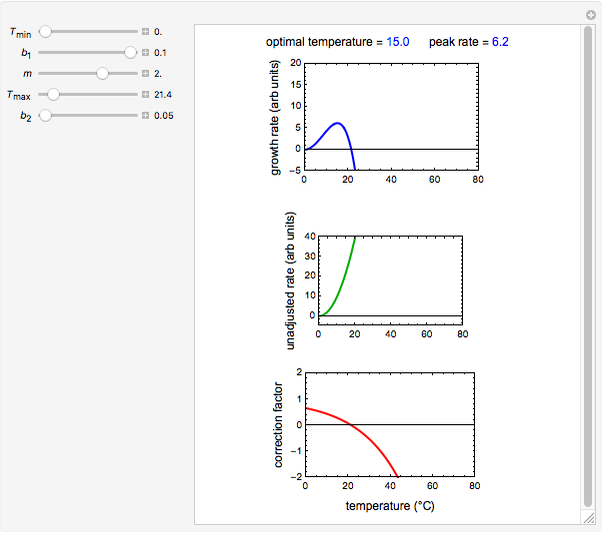
Snapshot 1: temperature effect on the growth and inactivation rates of a hypothetical psychrophilic bacterium generated with the modified Ratkowski model
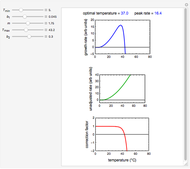
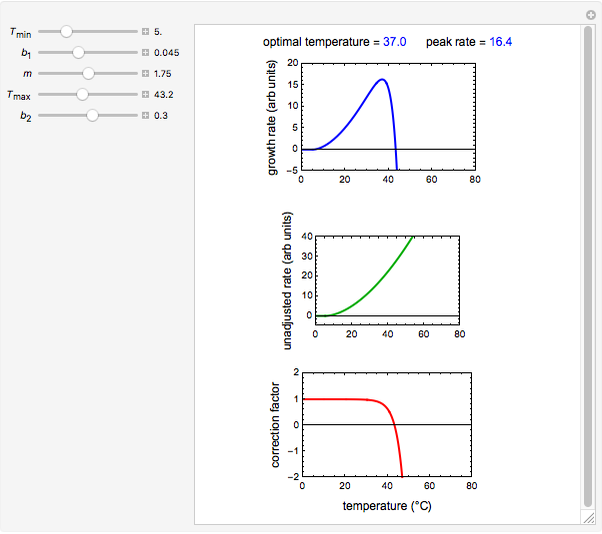
Snapshot 2: temperature effect on the growth and inactivation rates of a hypothetical mesophilic bacterium generated with the modified Ratkowski model
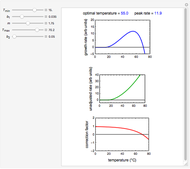
Snapshot 3: temperature effect on the growth and inactivation of a hypothetical thermophilic bacterium generated with the modified Ratkowski model
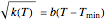
Ratkowski’s "square root model" was originally written in the form:
 ,
,
where  is the growth rate in chosen units,
  is the temperature and
  is the temperature below which growth ceases [1]. Actually, the model should be written in the form:
 , 0,
, 0,  ,
,
where  can, but need not always, be equal to 2 [2, 3]. Notice that without the added "If" statement, the original model's equation implies that at
  , the rate constant rises if
  , or becomes a complex number if is not an integer.
Micro- or macro-organism populations also have an optimal temperature  at which their growth rate peaks. At a temperature
  , usually slightly above it, growth not only ceases but turns into inactivation. In terms of the growth model, at
  , the growth rate
  changes sign and becomes negative.
The most useful version of Ratkowski’s modified model [4], which accounts for the minimum temperature, peak growth and eventual inactivation, has the form [5]:
 ,
,  ,
,  ,
,
where , ,  ,
,  and are the organism's growth characteristics in the particular medium or habitat.
This Demonstration simulates growth rate versus temperature curves from their initiation at a low temperature to the inactivation regime using the expanded version of the modified Ratkowski's model for graphical visualization, with its parameters , , , and entered with sliders. It also shows the correction factor  as a function of temperature, and displays the optimal temperature and corresponding peak growth rate
  calculated for the chosen parameter combination using the FindRoot function.
The purpose of this Demonstration is only to illustrate the features of the modified Ratkowski model, not to match the behavior of any particular micro- or macro-organism. Therefore, not all the parameter combinations allowed by the controls necessarily represent real-life growth/inactivation scenarios. Also, the Demonstration solely addresses the growth rate, however defined or determined, disregarding the potential effect of temperature on other growth parameters, notably the asymptotic growth level, and time to reach the inflection point [6].
References
[1] D. A. Ratkowski, J. Olley, T. A. McMeekin and A. Ball, "Relationship between Temperature and Growth Rate of Bacterial Cultures," Journal of Bacteriology, 149(1), 1982 pp. 1–5. jb.asm.org/content/149/1/1.full.pdf+html.
[2] J.-F. Briere, P. Pracros, A.-Y. Le Roux and J.-S. Pierre, "A Novel Rate Model of Temperature-Dependent Development for Arthropods," Environmental Entomology, 28(1), 1999 pp. 22–29. doi:10.1093/ee/28.1.22.
[3] L. Huang, C.-A. Hwang and J. Phillips, "Evaluating the Effect of Temperature on Microbial Growth Rate—The Ratkowski and a Bĕlehrádek-Type Models," Journal of Food Science, 76(8), 2011 pp. M547–M557. doi:10.1111/j.1750-3841.2011.02345.x.
[4] D. A. Ratkowski, R. K. Lowry, T. A. McMeekin, A. N. Stokes and R. E. Chandler, "Model for Bacterial Culture Growth Rate throughout the Entire Biokinetic Temperature Range," Journal of Bacteriology, 154(3), 1983 pp. 1222–1226.
[5] M. H. Zwietering, J. T. de Koos, B. E. Hasenack, J. C. de Wit and K. van't Riet, "Modeling of Bacterial Growth as a Function of Temperature," Applied and Environmental Microbiology, 57(4), 1991 pp. 1094–1101.
[6] M. Peleg and M. G. Corradini, "Microbial Growth Curves: What the Models Tell Us and What They Cannot," Critical Reviews in Food Science and nutrition, 51(10), 2011 pp. 917–945. doi:10.1080/10408398.2011.570463.
Permanent Citation
 Extending the Square Root Growth Rate Model to Lethal Low Temperatures
Mark D. Normand and Micha Peleg Uncertainties in Isothermal Microbial Growth
Mark D. Normand and Micha Peleg Biphasic Exponential Decay and Growth
Mark D. Normand and Micha Peleg Growth Curves for a Mixture of Two Subpopulations
Mark D. Normand, Przemyslaw Remin, and Micha Peleg Incipient Growth Processes with Competing Mechanisms
Mark D. Normand, Maria G. Corradini, and Micha Peleg De Novo Growth Processes with Competing Mechanisms
Mark D. Normand, Maria G. Corradini, and Micha Peleg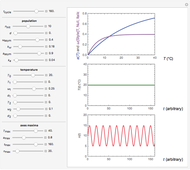 Effects of Temperature Fluctuations on Oscillating Biological Systems
Mark D. Normand and Micha Peleg Tumor Growth Model
Enrique Zeleny A Model for Population Growth
Samer Hassan and Joey Espino Model of Shell Growth
Stephen Wolfram
-
 Reaction Rate Dependence on Temperature and Moisture During Storage
Mark D. Normand -
 Ratkowski's Square Root Growth Rate Model for High Temperatures
Mark D. Normand -
 Gordon-Taylor and Fox Equations for Glass Transition Temperature
Mark D. Normand -
 Force to Overcome Vacuum Pull
Mark D. Normand -
Extending the Square Root Growth Rate Model to Lethal Low Temperatures
Mark D. Normand -
 Probability of Being Strange According to Paulos
Mark D. Normand -
 Successive Three-Point Method for Weibullian Chemical Degradation
Mark D. Normand -
 Effect of High Expense Charges on an Investment's Net Return
Mark D. Normand -
 Estimating Cohesion and Tensile Strength of Compacted Powders
Mark D. Normand -
 Three-Endpoints Method for Isothermal Weibullian Chemical Degradation
Mark D. Normand -
 Vitamin C Loss in Foods During Heat Processing and Storage
Mark D. Normand -
 Parameterizing Temperature-Viscosity Relations
Mark D. Normand -
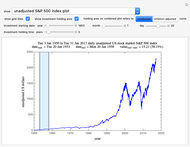 Fate of a Long-Term Index Fund Investment According to the S&P 500
Mark D. Normand -
 Laplace Distribution in Fluctuating Stock Index Records
Mark D. Normand -
 Weibullian Chemical Degradation
Mark D. Normand -
 Simulating Ascorbic Acid Degradation
Mark D. Normand -
 Additive and Multiplicative Risks
Mark D. Normand -
 Endpoints Method for Predicting Chemical Degradation in Frozen Foods
Mark D. Normand -
 Exponential Model for Arrhenius Activation Energy
Mark D. Normand -
 Prediction of Isothermal Degradation by the Endpoints Method
Mark D. Normand