Real Digits Carpet


Requires a Wolfram Notebook System
Interact on desktop, mobile and cloud with the free Wolfram Player or other Wolfram Language products.
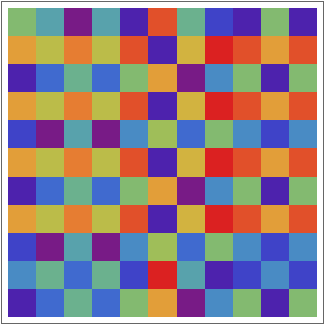
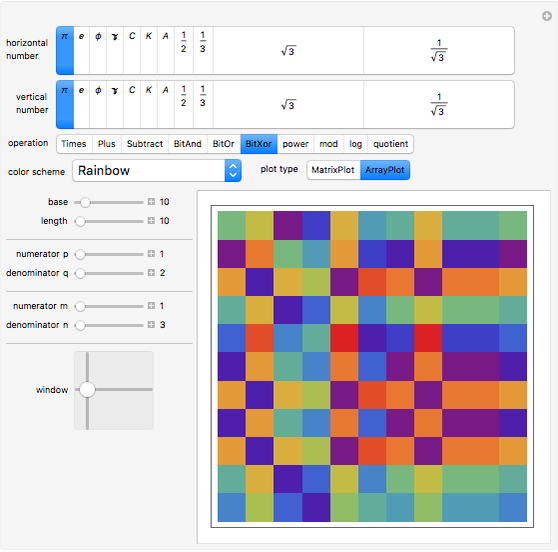
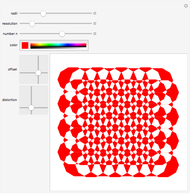
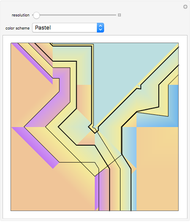
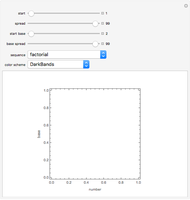
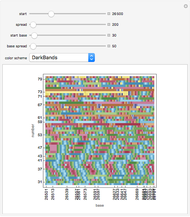
A matrix of values is formed by successively applying a binary operation to the first 1200 real digits of two numbers expressed in a chosen base. That is, the  entry of the matrix is obtained by combining the
  digit of the horizontal number with the
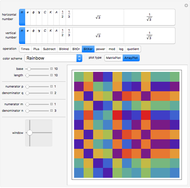
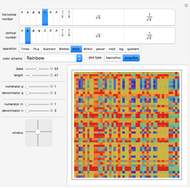
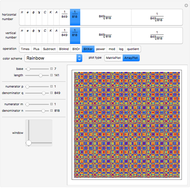
  digit of the vertical number using the chosen binary operation. The matrix is displayed using either of Mathematica's built-in functions ArrayPlot or MatrixPlot. The frame ticks on the matrix plot are indices to the digits being viewed. A 2D slider controller lets you look at a portion of the large matrix in a window with size set by the "length" slider. The first and second rational numbers
  and
and  in the top two rows of buttons are each set by sliders. The next numbers in the top two rows of buttons are
  raised to the power of and raised to the power of . These numbers will be irrational for most values of
  ,
,  , , and
  . The display is such that the element with the smallest indices is in the bottom left-hand corner.
Contributed by: Noel Patson (March 2011)
Open content licensed under CC BY-NC-SA
Snapshots


Details
Permanent Citation
 Number of Repeating Digits in Base b Expansion of Fractions
Noel Patson Generalized Digit Parity
Noel Patson Consecutive Digits in the Expansion of Pi
Hector Zenil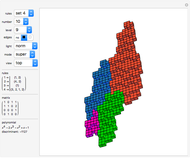 Rauzy Fractals of Order Four
Dieter Steemann Kenyon Tiling Construction (Boundary)
Dieter Steemann Kenyon Tiling Construction (Substitution)
Dieter Steemann Tracing Card Paths during Perfect Shuffles
Adam Rumpf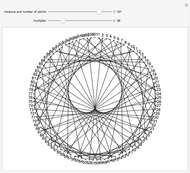 Modular Multiplication on a Circle
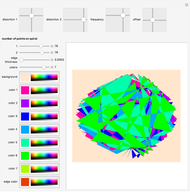
Ed Pegg Jr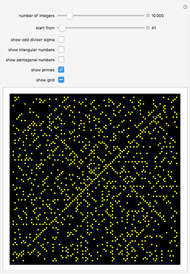 Experimenting with the Ulam Spiral
Giovanna Roda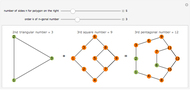 Adding Polygonal Numbers
Enrique Zeleny
-
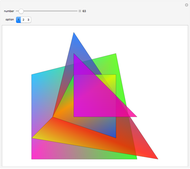
 Merging Mountains
Noel Patson -
 Lagrange's Four-Square Theorem Seen Using Polygons and Lines
Noel Patson -
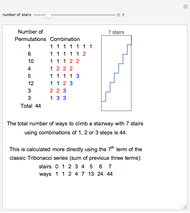 Ways of Stepping One, Two, or Three Stairs Up a Stairway
Noel Patson -
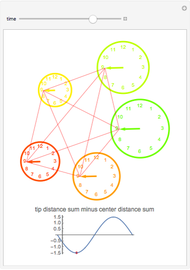 Clock Hand Tips
Noel Patson -
 Real Digits Carpet
Noel Patson -
 Line Art 3
Noel Patson -
 Overlapping Patterns
Noel Patson -
 Abstract Art
Noel Patson -
 Equal Incircles along a Line
Noel Patson -
 Three Touching Circles on a Line
Noel Patson -
 Prime Walk
Noel Patson -
 Irrational Digits Walk
Noel Patson -
 Generalized Digit Parity for Integer Sequences
Noel Patson -
 Möbius Mu Function Walk
Noel Patson -
Number of Repeating Digits in Base b Expansion of Fractions
Noel Patson -
 Generalized Kaprekar Routine
Noel Patson -
Generalized Digit Parity
Noel Patson -
 Oscillations of a Pogo Stick
Noel Patson -
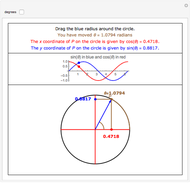 Relationship of Sine and Cosine to the Unit Circle
Noel Patson -
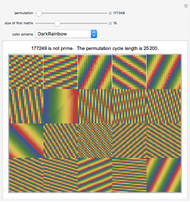 Square Matrix Permutations
Noel Patson