Recurrence Plot of Mathematical Functions and Constants

Requires a Wolfram Notebook System
Interact on desktop, mobile and cloud with the free Wolfram Player or other Wolfram Language products.
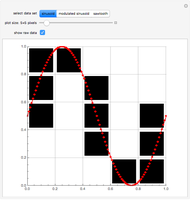
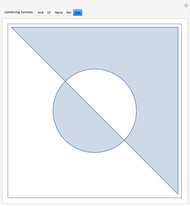
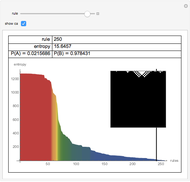
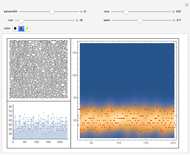
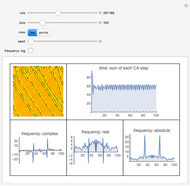
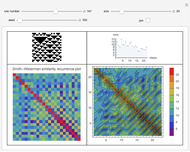
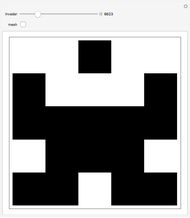
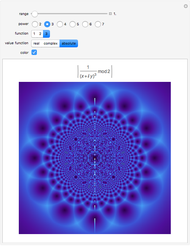
A recurrence plot illustrates the recurrence of states in a phase space where all the possible states of a system can be seen. Recurrence plots can be used to view and study mathematical functions such as sine and sinc or constants like  ,
,  and so on. In the case of a function
  , the values used are the finite sequence
  , where
  is the size. In the case of a number, the values used are the digits of its decimal expansion taken to
  places.
Contributed by: Daniel de Souza Carvalho (March 2011)
Open content licensed under CC BY-NC-SA
Snapshots
Details
Reference: Recurrence Plots
Permanent Citation


