Sample Size Calculation - Means


Requires a Wolfram Notebook System
Interact on desktop, mobile and cloud with the free Wolfram Player or other Wolfram Language products.
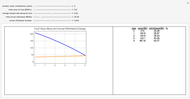
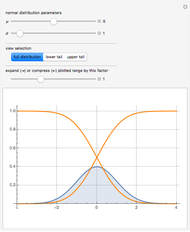
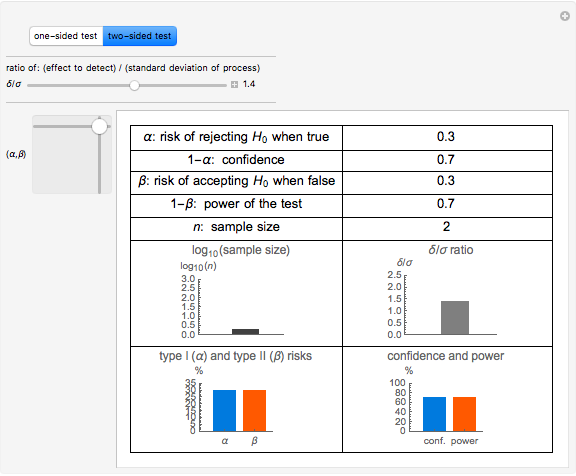
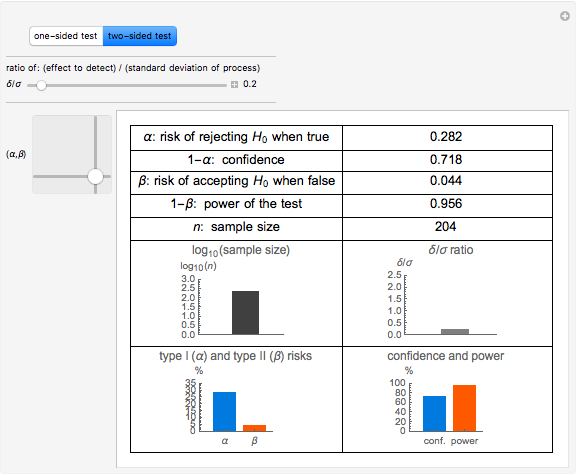
This Demonstration calculates the minimum sample size,  , required to be randomly drawn from a population, to be able to detect a difference in the population mean of at least
  units from the true population mean with confidence of
  . You can vary
  (the Type I risk),
  (the Type II risk), or
  , the ratio of the detected difference to the population standard deviation. In most practical cases, the standard deviation may not actually be known, but is estimated from prior knowledge or experience.
Contributed by: Joe O'Hara (March 2011)
Open content licensed under CC BY-NC-SA
Snapshots


Details
Suppose an experiment is to be conducted where a treatment of some sort is to be applied to a population. The investigator is interested in knowing the minimum sample size that should be randomly selected from the population to detect a change in the mean of the population as a result of the treatment. The statistical factors that influence the sample size are:
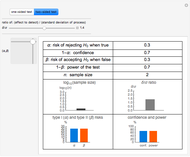
- the value selected for , the Type I risk (the risk of rejecting a true null hypothesis,  )
- the value selected for , the Type II risk (the risk of accepting the null hypothesis,
)
- the value selected for , the Type II risk (the risk of accepting the null hypothesis, , as true when, in reality, it is false)
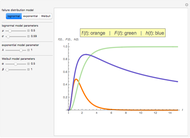
- the value of the population standard deviation, σ (this is often an estimate, based on judgement and experience)
- the size (relative to σ) of the effect to be detected by the sample
, as true when, in reality, it is false)
- the value of the population standard deviation, σ (this is often an estimate, based on judgement and experience)
- the size (relative to σ) of the effect to be detected by the sample
The Type I risk is that of getting a false positive from the sample. In other words, there is a probability of that the sample will indicate that there is a difference of at least when, in fact, there is not.
The Type II risk is that of getting a false negative from the sample. In other words, there is a probability of that the sample will indicate there is not a difference of at least when, in fact, there is such a difference. The ability to detect a difference when there actually is one is called the power of the test and is equal to  .
.
Additionally, whether the test of the hypothesis is a one-sided or two-sided test has an effect on the sample size. A one-sided test would, for example, look at whether there is an increase OR a decrease in the mean (not both), whereas a two-sided test would consider whether the mean is EITHER more than or less than the value in the null hypothesis.
When using this Demonstration, you should mentally formulate a null hypothesis and an alternative hypothesis (either one- or two-sided). Then the appropriate control selections can be made and the resulting sample sizes can be examined.
Typical values for and are 0.05 and 0.20, respectively, resulting in a confidence of 95% and a test power of 80%.
Note that looking for a small difference, , drives a large sample size, as would be expected.
Permanent Citation
 Sample Size Calculation - Proportions
Joe O'Hara Calculating Sample Size
Daniel de Souza Carvalho Distribution of the Means of Samples Having Random Sizes
Mark D. Normand, Joseph Horowitz, and Micha Peleg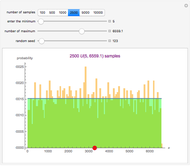 Impact of Sample Size on Approximating the Uniform Distribution
Paul Savory (University of Nebraska-Lincoln)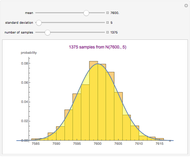 Impact of Sample Size on Approximating the Normal Distribution
Paul Savory (University of Nebraska-Lincoln)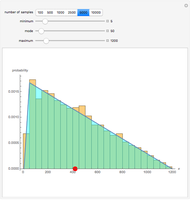 Impact of Sample Size on Approximating the Triangular Distribution
Paul Savory (University of Nebraska-Lincoln)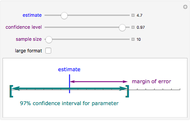 Confidence Intervals: Confidence Level, Sample Size, and Margin of Error
Eric Schulz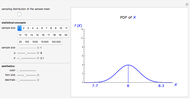 Sampling Distribution of the Sample Mean
Jim R Larkin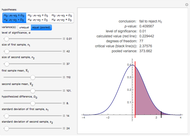 Comparing Two Means Using Independent Samples of Unknown Variance
Shailesh S. Kulkarni and Hakan Tarakci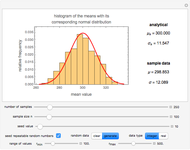 Central Limit Theorem Applied to Samples of Different Sizes and Ranges
Mark D. Normand and Micha Peleg