Simulating the Poisson Process


Requires a Wolfram Notebook System
Interact on desktop, mobile and cloud with the free Wolfram Player or other Wolfram Language products.
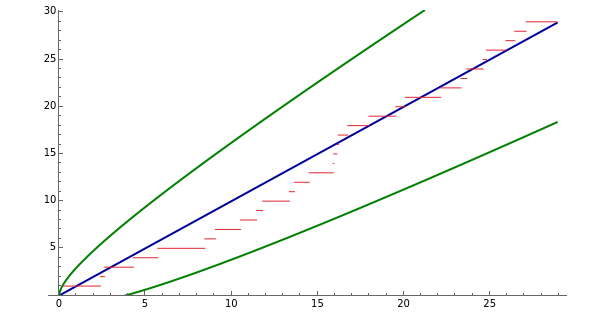
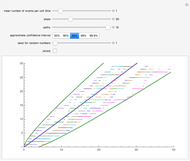
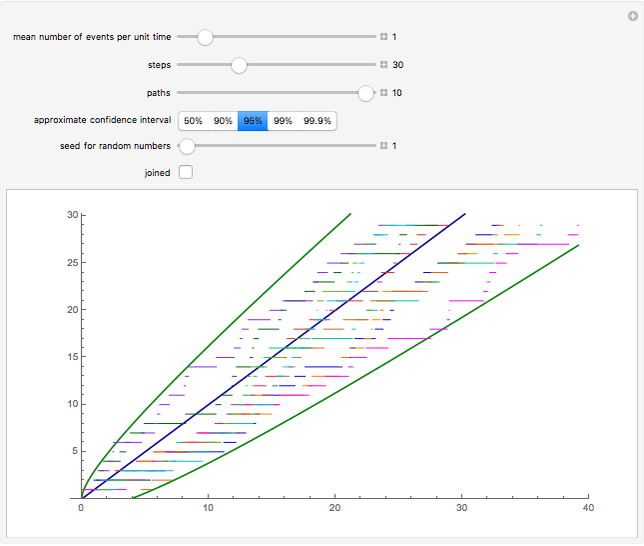
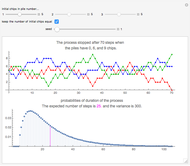
This Demonstration shows simulated paths of the Poisson process. You can see how the cumulative number of events increases as time lapses. You can adjust the mean number of events per unit time. The Demonstration also shows the mean of the process (the blue line) and approximate confidence intervals (the green curves). The confidence intervals are based on the normal approximation to the Poisson distribution. The Poisson process is a special case of a continuous-time Markov chain.
Contributed by: Heikki Ruskeepää (March 2011)
Open content licensed under CC BY-NC-SA
Snapshots
Details
Snapshot 1: unjoined paths
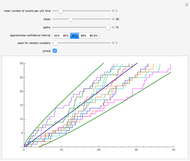
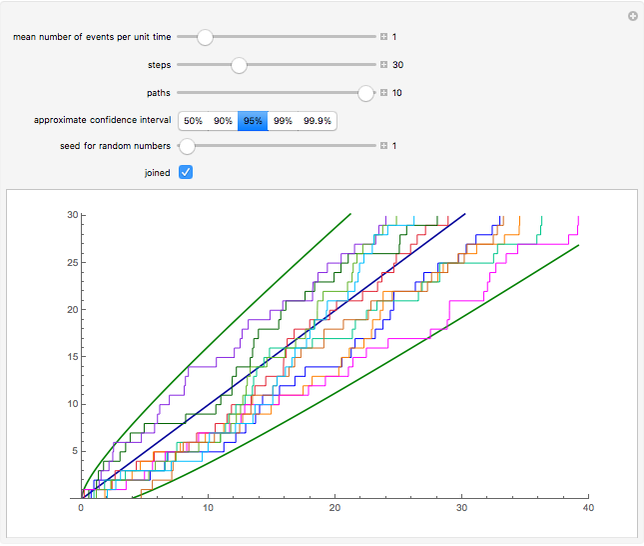
Snapshot 2: joined paths
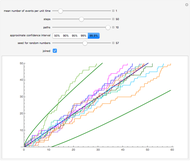
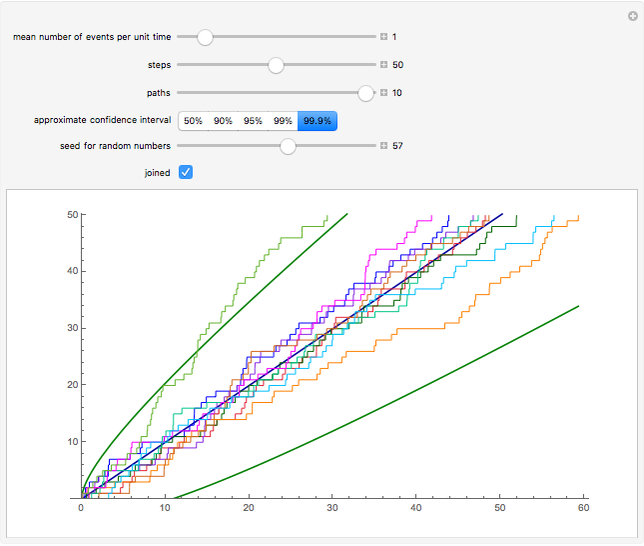
Snapshot 3: one of the paths goes outside of the 99.9% confidence interval
Snapshots 1 and 2 are the same except that in Snapshot 2 the paths are joined. These snapshots show that when you show several paths, joining the paths with vertical lines makes the paths clearer.
Recall that in a Poisson process events occur randomly in time. If time starts at 0, then the number of events occurring up to time  is a random variable that has a Poisson distribution with mean
  . Here,
  is the mean number of events that occur in one unit of time. The time between the events has an exponential distribution with mean
  .
.
For the Poisson process, see [1, pp. 204–208]. For simulation of the Poisson process and other stochastic processes with Mathematica, see [2, pp. 987–1002]. Andrzej Kozlowski has also created a Demonstration, The Poisson Process, that shows simulated paths of the Poisson process. That Demonstration also shows so-called compensated Poisson processes but does not show the mean or confidence intervals.
[1] A. O. Allen, Probability, Statistics, and Queueing Theory with Computer Science Applications, 2nd ed., Boston: Academic Press, 1990.
[2] H. Ruskeepää, Mathematica Navigator: Mathematics, Statistics, and Graphics, 3rd ed., San Diego, CA: Elsevier Academic Press, 2009.
Permanent Citation
"Simulating the Poisson Process"
http://demonstrations.wolfram.com/SimulatingThePoissonProcess/
Wolfram Demonstrations Project
Published: March 7 2011
 The Poisson Process
Andrzej Kozlowski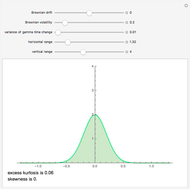 The Return Distribution of the Variance Gamma Process
Andrzej Kozlowski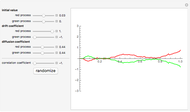 Correlated Wiener Processes
Andrzej Kozlowski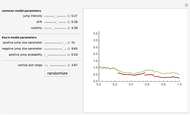 Two Jump Diffusion Processes
Andrzej Kozlowski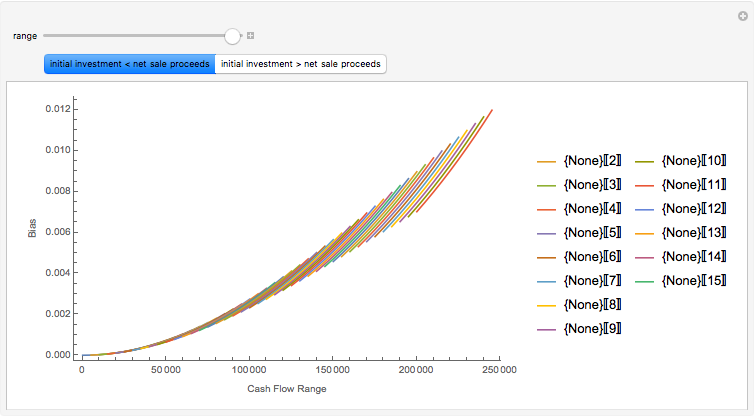 Simulating the IRR
Roger J. Brown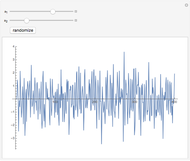 Auto-Regressive Simulation (Second-Order)
David von Seggern (University of Nevada)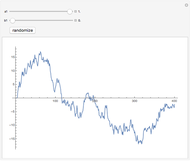 Autoregressive Moving-Average Simulation (First Order)
David von Seggern (University of Nevada) Correlated Gamma Variance Processes with Common Subordinator
Andrzej Kozlowski Mean-Reverting Random Walks
Jason Cawley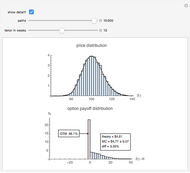 Monte Carlo Valuation of an Option
N. T. Gladd
-
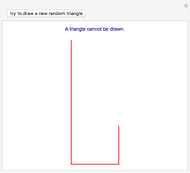
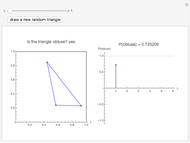 Obtuse Random Triangles from Three Points in a Rectangle
Heikki Ruskeepää -
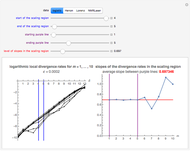 Chaotic Data: Maximal Lyapunov Exponent
Heikki Ruskeepää -
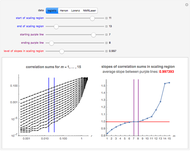 Chaotic Data: Correlation Dimension
Heikki Ruskeepää -
 Chaotic Data: Delay Time and Embedding Dimension
Heikki Ruskeepää -
 Method of Support Vector Regression
Heikki Ruskeepää -
 Local Regression for Country Data
Heikki Ruskeepää -
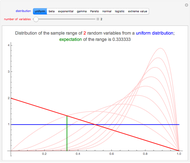 Distribution of the Sample Range of Continuous Random Variables
Heikki Ruskeepää -
 Distribution of the Sample Range of Discrete Random Variables
Heikki Ruskeepää -
 Distributions of Discrete Order Statistics
Heikki Ruskeepää -
 Distributions of Continuous Order Statistics
Heikki Ruskeepää -
 Waiting for the Next Record
Heikki Ruskeepää -
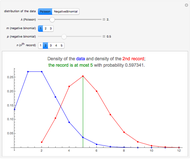 Distribution of Discrete Records
Heikki Ruskeepää -
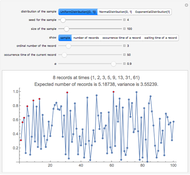 Records in Sequences of Random Variables
Heikki Ruskeepää -
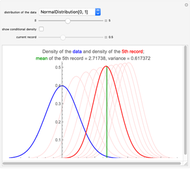 Distribution of Records
Heikki Ruskeepää -
 The Three-Tower Problem
Heikki Ruskeepää -
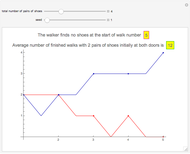 Walking Randomly Until No Shoes Are Available
Heikki Ruskeepää -
 A Reluctant Random Walk
Heikki Ruskeepää -
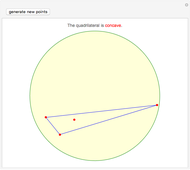 Concave Random Quadrilaterals from Four Points in a Disk
Heikki Ruskeepää -
 Obtuse Random Triangles from Three Parts of the Unit Interval
Heikki Ruskeepää -
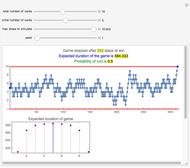
 Spin Game
Heikki Ruskeepää