Stacked Bar Chart for Neighborhood Residential Composition

Requires a Wolfram Notebook System
Interact on desktop, mobile and cloud with the free Wolfram Player or other Wolfram Language products.
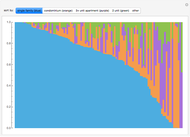
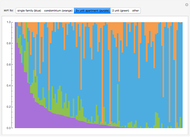
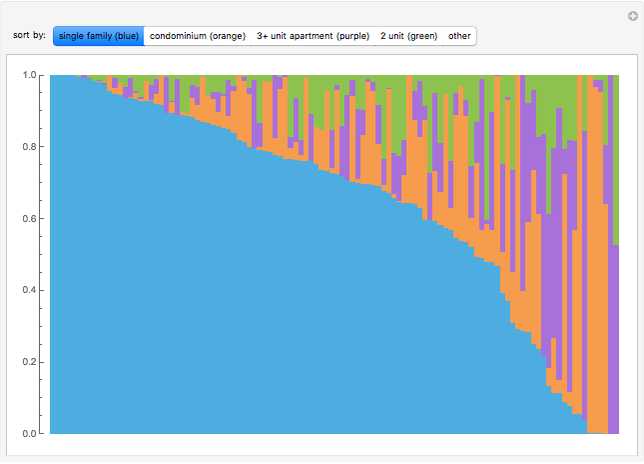
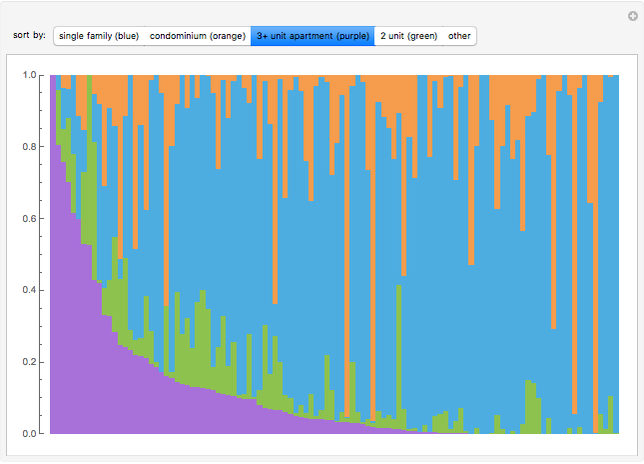
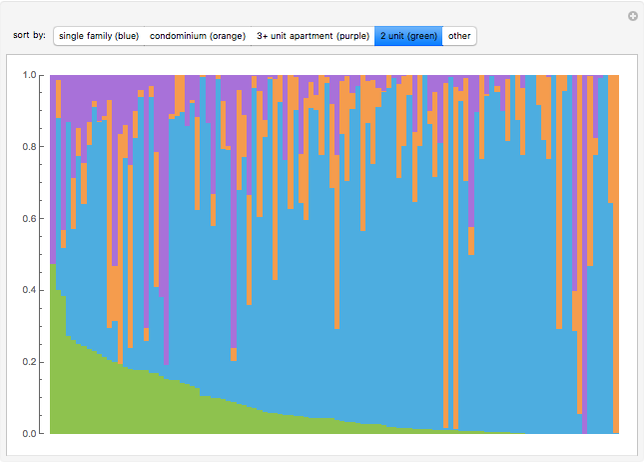
This Demonstration compares administrative subdivisions (wards) of Madison, Wisconsin with respect to their residential composition. Densely populated areas of a city tend to have more apartment buildings and condominiums than single-family homes. Each column of the chart represents one ward of Madison, colored in proportion to how much living area (as a percent of total) is of a certain kind. Choose a colored button to sort the wards by makeup (this may take a few seconds). Mouseover a column to get data about an individual ward.
Contributed by: Ethan Beihl (December 2015)
Open content licensed under CC BY-NC-SA
Snapshots


Details
This data was obtained from an open dataset [1] of property-tax assessment information provided by the City of Madison, Wisconsin.
Reference
[1] City of Madison, WI. "Assessor Property Information." (Nov 24, 2015). https://data.cityofmadison.com/Property/Assessor-Property-Information/u7ns-6d4x.
Permanent Citation
"Stacked Bar Chart for Neighborhood Residential Composition"
http://demonstrations.wolfram.com/StackedBarChartForNeighborhoodResidentialComposition/
Wolfram Demonstrations Project
Published: December 9 2015
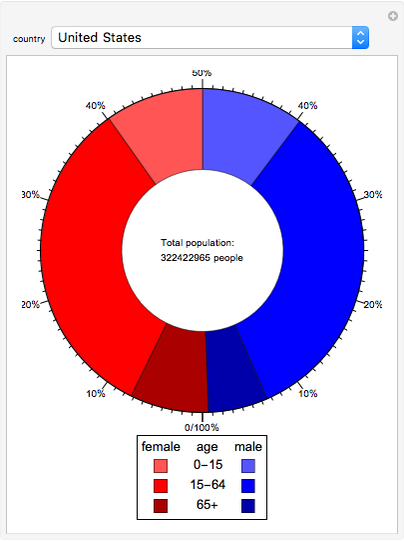 Population Donut Chart
Brett Champion Populations of Cities
Jon McLoone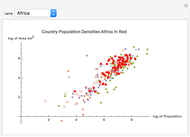 Human Population Densities by Continent
Trevor Cole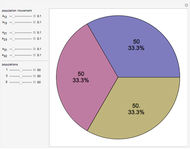 Movement between Three Populations in a Closed System
Alex Bongiovanni (Science and Math Academy)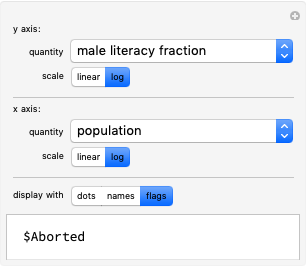 Comparing Data on Countries
Stephen Wolfram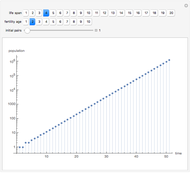 Mortal Fibonacci Rabbits
Oleksandr Pavlyk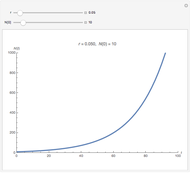 Continuous Exponential Growth
Gareth Russell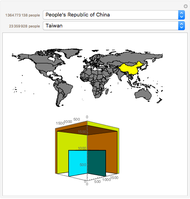 Population Cube
Michael Schreiber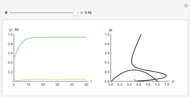 Bifurcation in a Model of Spruce Budworm Populations
Selwyn Hollis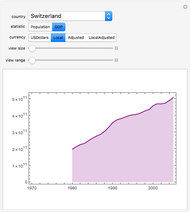 Country Statistics over Time
Alan Joyce