Stochastic Model of Microbial Injury and Mortality

Requires a Wolfram Notebook System
Interact on desktop, mobile and cloud with the free Wolfram Player or other Wolfram Language products.
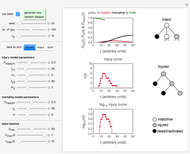
During microbial inactivation, especially under marginal or sub-lethal conditions, cells or spores of the targeted organism can exist in one of three states: dead (fully inactivated), injured, or intact, with corresponding time-dependent probabilities. In this Demonstration, the process is simulated starting with a chosen number of intact cells or spores, generating their Markov trees, recording their state after time increments, and displaying the results. The survival and injury curves so produced let you compare the stochastic behavior of small cell or spore populations and almost fully deterministic behavior of large populations. The curves can also be used to examine how the varying probabilities of each state affect the survival and injury patterns.
Contributed by: Mark D. Normand , Maria G. Corradini, and Micha Peleg (September 2014)
Open content licensed under CC BY-NC-SA
Snapshots


Details
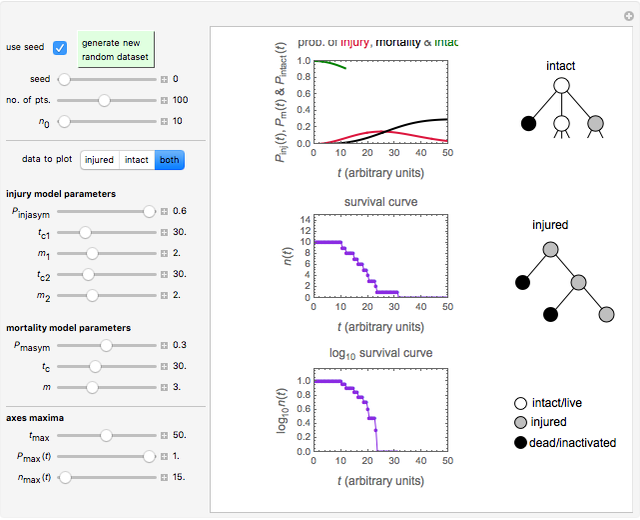
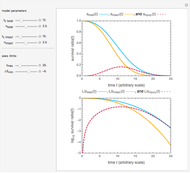
Snapshot 1: survival curve of a small ( ) population
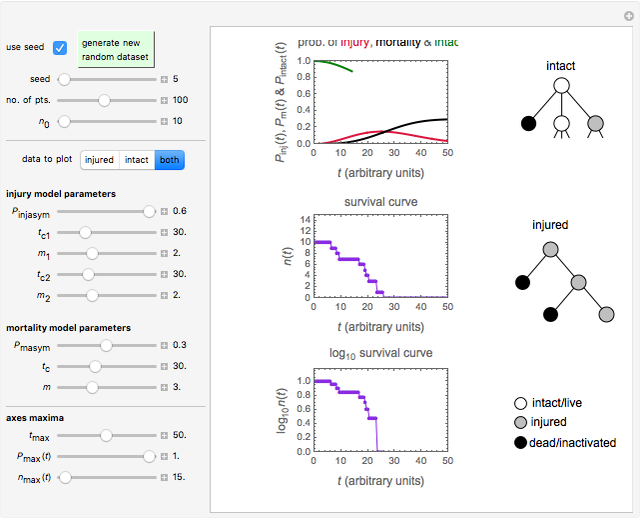
Snapshot 2: survival curve of another small () population
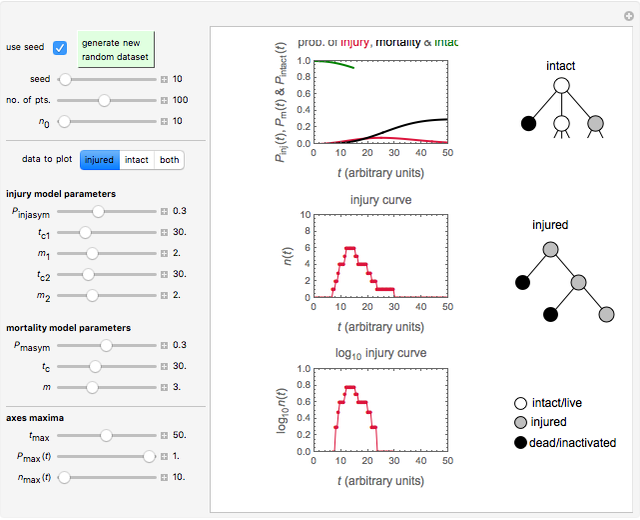
Snapshot 3: injury curve of a small () population
Snapshot 4: injury curve of another small () population
Snapshot 5: the number of intact cells in a large ( ) population
Snapshot 6: the number of injured cells in a large () population
Snapshot 7: the survival curve of a large () population
Using a stochastic model, this Demonstration simulates the mortality, injury, and intact-survival patterns of a microbial population exposed to a hostile environment or lethal agent, such as thermal processing, ultra-high hydrostatic pressure, or chemical disinfection [1, 2]. The starting point is a chosen initial number of intact cells or spores  to
to  at
at  ). After a unit time increment
  there is a probability
  that each individual microbe will be dead or fully inactivated,
  that it will be injured, and
 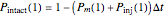 that it will remain intact, where
  ,
,  , and
, and  are the values of the corresponding probability rate functions. If the microbe, vegetative cell, or spore survived the first round intact, then after another time increment , it will have a probability of
  that it will die or be inactivated,
  that it will be injured, and
 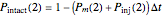 that it will still remain intact. If the microbe were injured in round 1, there is a probability that the microbe will die or be inactivated, and a probability
  that it remains injured. The schematic diagram to the right of the plots shows the possible states of an intact or injured cell or spore. The process is iterated (
 ) until the microbe dies off or the maximum assigned number of iterations is reached. The procedure is repeated with each of the
  individual microbes. The temporary number of microbes at each state (after each iteration) is recorded. The "data to plot" setter is used to select which bottom two plots are visible, that is, those of the injured microbes, intact microbes, or both.
The equations used to calculate and display the probability rate functions are 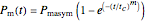 ,
, 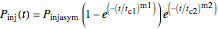 , and
, and 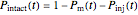 . In these equations the
  's are the upper asymptotic levels of the three probability rate functions, the
  's are characteristic times and the
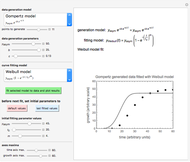
  's are shape factors controlling the steepness of the terms around their inflection points. These variables are entered with sliders. Also entered with sliders are the initial number of intact cells or spores, , the seed of the random number generator and the number of data points (iterations or increments) and the plots' axes maxima.
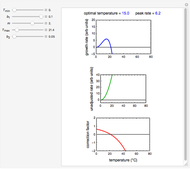
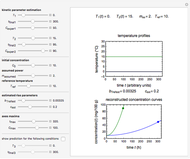
The top plot displays the three probability rate functions. The chosen injury curve, intact number curve, or traditional survival curve, constructed as their sum, are displayed on linear and semilogarithmic coordinates in the middle and bottom plots, respectively. Notice that the  curve is truncated at the point where there are no remaining intact cells or spores. Also note that not all the allowed parameter combinations necessarily have a corresponding real microbial population.
The mathematical model used in this Demonstration does not take into account the degree of injury and that the probability rate functions could be not only functions of time but could also vary within the branches of the Markov tree. Despite these oversimplifications, the model provides a realistic view of the changing roles of mortality and injury and of the differences in the responses of small and large microbial populations to a hostile environment.
References
[1] V. C. H. Wu, "A Review of Microbial Injury and Recovery Methods in Foods," Food Microbiology, 25, 2008 pp. 735–744.
[2] M. G. Corradini and M. Peleg, "A Weibullian Model of Microbial Injury and Mortality," International Journal of Food Microbiology, 119(3), 2007 pp. 319–328. doi:10.1016/j.ijfoodmicro.2007.08.035.
Permanent Citation
 Injury in Microbial Inactivation
Mark D. Normand and Micha Peleg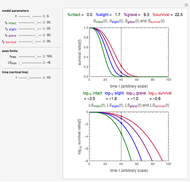 Degrees of Microbial Injury and Survival
Mark D. Normand and Micha Peleg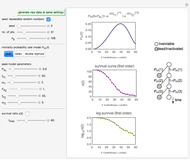 Probabilistic Model Showing Sigmoid Semilogarithmic Survival
Mark D. Normand, Micha Peleg, and Zack J. Rosenthal Extracting Microbial Inactivation Parameters from Final Isothermal Survival Ratios
Mark D. Normand and Micha Peleg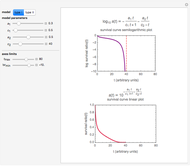 Sigmoid Microbial Survival Curves
Mark D. Normand and Micha Peleg Square Root Model for Rates of Microbial Growth or Inactivation
Mark D. Normand and Micha Peleg Lag Time in Microbial Growth
Mark D. Normand and Micha Peleg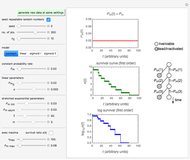 Probabilistic Model for Microbial Mortality
Mark D. Normand and Micha Peleg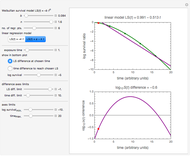 Weibullian versus Log-Linear Microbial Survival Models
Mark D. Normand and Micha Peleg Extracting Microbial Inactivation Parameters from Final Survival Ratios
Mark D. Normand and Micha Peleg
-
 Ratkowski's Square Root Growth Rate Model for High Temperatures
Micha Peleg -
 Gordon-Taylor and Fox Equations for Glass Transition Temperature
Micha Peleg -
 Force to Overcome Vacuum Pull
Micha Peleg -
 Extending the Square Root Growth Rate Model to Lethal Low Temperatures
Micha Peleg -
 Probability of Being Strange According to Paulos
Micha Peleg -
 Successive Three-Point Method for Weibullian Chemical Degradation
Micha Peleg -
 Estimating Cohesion and Tensile Strength of Compacted Powders
Micha Peleg -
 Three-Endpoints Method for Isothermal Weibullian Chemical Degradation
Micha Peleg -
 Vitamin C Loss in Foods During Heat Processing and Storage
Micha Peleg -
 Parameterizing Temperature-Viscosity Relations
Micha Peleg -
 Laplace Distribution in Fluctuating Stock Index Records
Micha Peleg -
 Weibullian Chemical Degradation
Micha Peleg -
 Simulating Ascorbic Acid Degradation
Micha Peleg -
 Additive and Multiplicative Risks
Micha Peleg -
 Endpoints Method for Predicting Chemical Degradation in Frozen Foods
Micha Peleg -
 Exponential Model for Arrhenius Activation Energy
Micha Peleg -
 Prediction of Isothermal Degradation by the Endpoints Method
Micha Peleg -
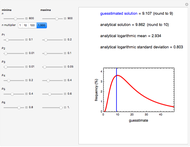 Risk Guesstimation from Factor Ranges
Micha Peleg -
 Volatiles Formation Kinetics in Stored Fish
Micha Peleg -
 Comparison of Six Sigmoid Growth Curve Models
Micha Peleg