T-x-y and x-y Diagrams for Binary Vapor-Liquid Equilibrium (VLE) in Flash Drum


Requires a Wolfram Notebook System
Interact on desktop, mobile and cloud with the free Wolfram Player or other Wolfram Language products.
The  -
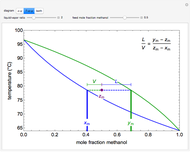
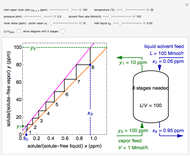
- diagram (vapor mole fraction versus liquid mole fraction) for vapor-liquid equilibrium (VLE) is shown for a methanol/water mixture being fed to a flash drum. The corresponding
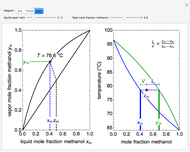
  -- diagram shows how the points on the - diagram are obtained; each point corresponds to a different temperature. Use buttons to view the - and -- diagrams separately or to view both simultaneously. Use the "liquid/vapor ratio" slider to select the ratio leaving the flash drum; use the other slider to select the feed composition to the flash separation.
Contributed by: Adam J. Johnston (October 2016)
Additional contributions by: Rachael L. Baumann and John L. Falconer
(University of Colorado Boulder, Department of Chemical and Biological Engineering)
Open content licensed under CC BY-NC-SA
Snapshots


Details
A feed with a composition  is flashed (vaporized). On the - diagram, the slope of the purple line is
  , where
  and
and  are the numbers of moles of liquid and vapor leaving, respectively. The intersection of the
  line with the black equilibrium curve gives the mole fractions of methanol in the exiting vapor (green) and liquid (blue) streams. Because VLE is assumed, the mole fractions of methanol in these streams correspond to the horizontal line on the -- diagram. The purple dot on the -- diagram represents the feed mole fraction of methanol, and the lever rule is used to determine the liquid/vapor molar ratio.
Reference
[1] P. C. Wankat, Separation Process Engineering: Includes Mass Transfer Analysis, 3rd ed., Upper Saddle River, NJ: Prentice Hall, 2012.
Permanent Citation
 Apply the Hunter-Nash Method to Liquid-Liquid Extraction
Rachael L. Baumann Temperature-Entropy Diagram for Water
Adam J. Johnston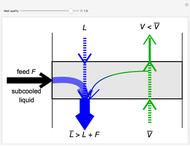 Feed Stages in a Distillation Column
Rachael L. Baumann Energy Balance on Pressurizing a Tank
Rachael L. Baumann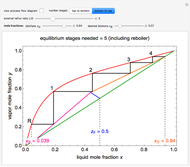 McCabe-Thiele Method for Methanol/Water Separation
Neil Hendren and Rachael L. Baumann Rankine Cycle
Rachael L. Baumann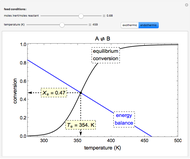 Reversible Reaction in an Adiabatic Plug-Flow Reactor
Rachael L. Baumann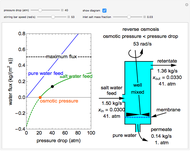 Reverse Osmosis
Muqbil Alkhalaf and Rachael L. Baumann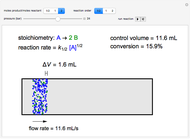 Volumetric Flow Rates in a Plug Flow Reactor
Rachael L. Baumann and Adam J. Johnston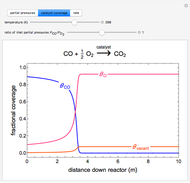 Langmuir-Hinshelwood Reaction in a Plug Flow Reactor
Garrison J. Vigil
-
 Operation of an Absorption Column
Adam J. Johnston -
Feed Stages in a Distillation Column
Adam J. Johnston -
 T-x-y and x-y Diagrams for Binary Vapor-Liquid Equilibrium (VLE) in Flash Drum
Adam J. Johnston -
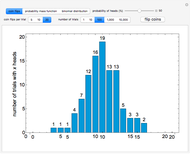 Binomial Distribution via Coin Flips
Adam J. Johnston -
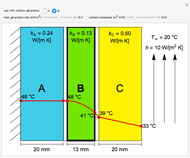 Heat Generation and Conduction through Composite Walls
Adam J. Johnston -
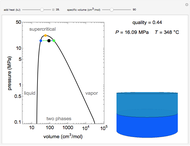 Pressure-Volume Diagram for Heating a Vapor-Liquid Mixture at a Constant Volume
Adam J. Johnston -
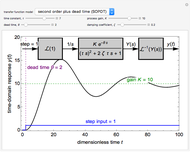 First- and Second-Order Transfer Functions
Adam J. Johnston -
Volumetric Flow Rates in a Plug Flow Reactor
Adam J. Johnston -
 Pressure-Temperature Diagram for a Binary Mixture
Adam J. Johnston -
Temperature-Entropy Diagram for Water
Adam J. Johnston -
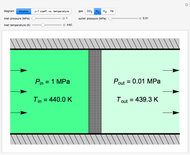 Joule-Thomson Expansion
Adam J. Johnston