The Minimal Model of the Complexity of Financial Security Prices

Requires a Wolfram Notebook System
Interact on desktop, mobile and cloud with the free Wolfram Player or other Wolfram Language products.
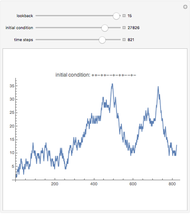
A representative investor trades a single asset using the simplest possible rule (see Details) and still generates complexity. The investor looks back a fixed number of days to decide whether to buy or sell. The initial condition is the first sequence of ups and downs the trader experiences, after which his decisions set the prices for all future time steps.
Contributed by: Philip Maymin (March 2011)
Open content licensed under CC BY-NC-SA
Snapshots
Details
What is the simplest rule to model the complexity and randomness of financial markets? It is easy to mimic security prices by introducing randomness, either externally with a random walk or internally through large structures such as cellular automata involving trade between many investors, but what are the minimal models that generate complexity?
A single investor trading in a single security can generate complex price behavior all by himself. He makes trading decisions by looking back at the signs of the price change over the past few days. Because he is the representative investor, the price adjusts with his decisions.
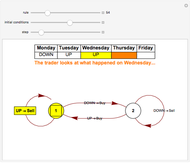
The investor is modeled with an iterated finite automaton with only two states: an optimistic contrarian state and a pessimistic trend-following state. He starts each day in the optimistic contrarian state. This state is contrarian because it sells on upticks and buys on downticks. It is optimistic because it remains in this state so long as the market keeps going up. On the first downtick, it transitions to the other state, the pessimistic trend-following state. This state is trend-following because it buys on upticks and sells on downticks. It is pessimistic because it remains in this state so long as the market keeps going down. On the first uptick, it transitions back to the original state.
The investor follows these transitions by looking at the past few days of price changes, starting with the most recent day. The decision to buy or sell is modeled as his current thinking as he goes through the past few days, and once he reaches the last day of his lookback window, he makes his final decision to buy or sell. The next day, he starts all over.
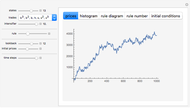
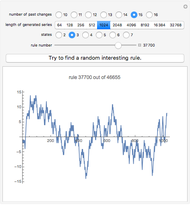
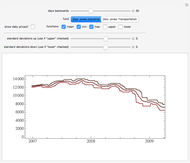
Despite the simplicity of the rule, it generates a wide variety of possible price movements, depending on how many days the trader looks back each day and on the initial conditions.
Note in the Snapshots how sometimes volatility starts small and then increases, and sometimes it starts large and decreases. A price series that appears stable can suddenly collapse, and after a collapse can remain low, or can come back up.
Because the investor looks back a fixed number of days, the price series is guaranteed to eventually cycle. However, this cycle length can be quite long. For example, a 15-business-day lookback, absent any external changes, will cycle in about 130 years.
For more details, see this 8-page poster.


