A Model for Monomer and Micellar Concentrations in Surfactant Solutions


Requires a Wolfram Notebook System
Interact on desktop, mobile and cloud with the free Wolfram Player or other Wolfram Language products.
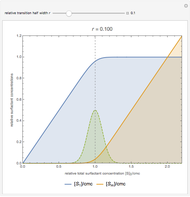
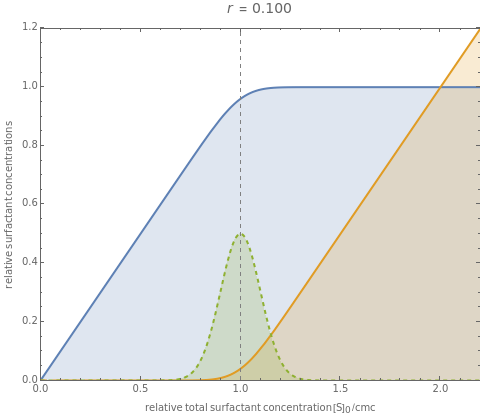
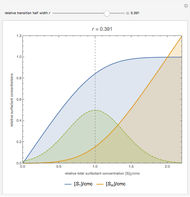
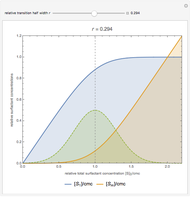
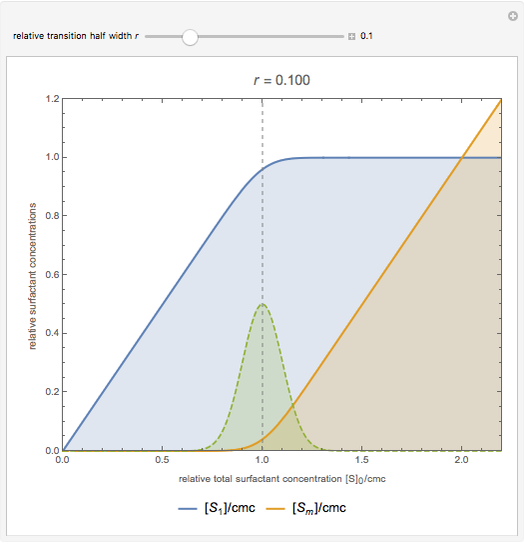
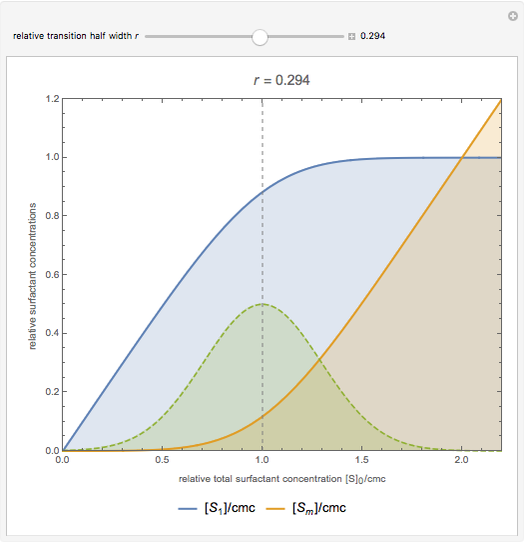
This Demonstration shows monomer and micellar concentrations in surfactant solutions. In particular, it shows the effect of the relative transition width  on the concentration of monomeric surfactant
  (blue) and micellized surfactant
  (red) near the critical micelle concentration (cmc). The horizontal axis represents the relative total surfactant concentration
 . The vertical dashed line at
  indicates the cmc. The dashed brown curve is a Gaussian function centered at the cmc with half width
  .
.
Contributed by: Wajih Al-Soufi (December 2014)
Universidade de Santiago de Compostela
Open content licensed under CC BY-NC-SA
Snapshots


Details
The concentrations are calculated with the model equations given in [1].
Reference
[1] W. Al-Soufi, L. Piñeiro, and M. Novo, "A Model for Monomer and Micellar Concentrations in Surfactant Solutions: Application to Conductivity, NMR, Diffusion, and Surface Tension Data," Journal of Colloid and Interface Science, 370(1), 2012 pp. 102–110. doi:10.1016/j.jcis.2011.12.037.
 A Contact Element in Rheological Models
Mark D. Normand and Micha Peleg Gordon-Taylor and Fox Equations for Glass Transition Temperature
Mark D. Normand and Micha Peleg Two-Phase Fluid Flow in Porous Media
Clay Gruesbeck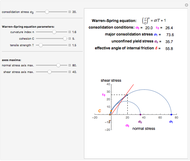 Principal Stresses in Compacted Cohesive Powders
Mark D. Normand and Micha Peleg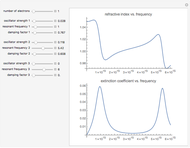 Lorentz Oscillator Model for Optical Constants
Yug Joshi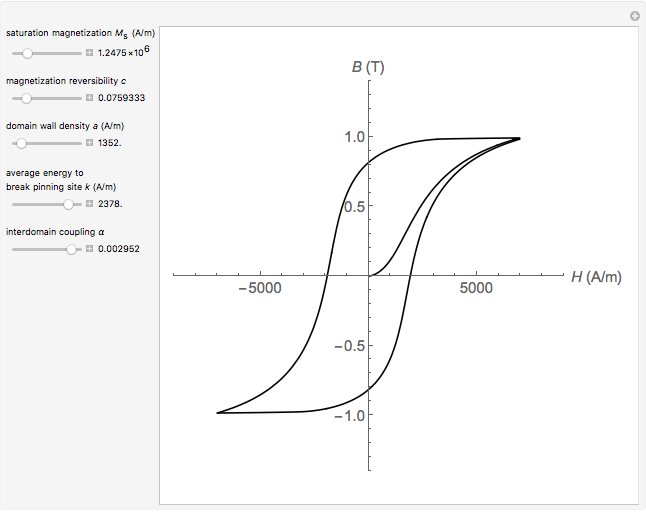 Jiles-Atherton Model of Magnetic Hysteresis
Santosh Kumar and Tarun Tummuru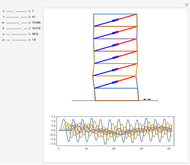 Model for Earthquake on a Tall Building
Enrique Zeleny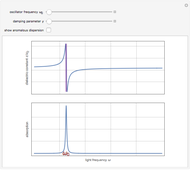 Drude-Lorentz Model for Dispersion in Dielectrics
S. M. Blinder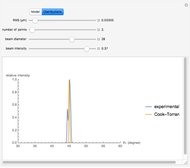 Comparing the Cook-Torrance BRDF Model with Diffuse Reflection Simulation
D. Meliga, S. Z. Lavagnino and G. Valorio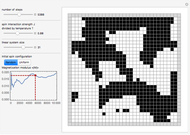 The 2D Ising Model Monte Carlo Simulation Using the Metropolis Algorithm
Darya Aleinikava