A Theory of Insurance Lapses


Requires a Wolfram Notebook System
Interact on desktop, mobile and cloud with the free Wolfram Player or other Wolfram Language products.
Having a good model of "lapse" is crucial to understanding insurance economics and insurance regulation. Here is why. Many life insurance policies, long-term care insurance policies, disability insurance policies, and other policies with a lengthy term generally excuse an insurer from any otherwise existing duty to pay benefits if the policy has "lapsed." Lapse means that the insured has failed to make periodic payments to the insurer required under the policy. A lapse can result in the insured "forfeiting" a large sum of money because for early years of the policy, these periodic premium payments significantly exceed expected indemnity payouts from the insurer. This excess is collected for a reason. If the policy does not lapse, during the later years of the policy when mortality or morbidity has increased significantly, but premiums have not increased commensurately, the insurer will then have earned enough profit on the policy to support the higher expected indemnity payments. Thus, the greater the likelihood of early lapse, the more an insurer tends to profit or, in a competitive market, to lower prices. "Non-forfeiture" payments the insurer is required by contract or regulation to make to the insured upon lapse thus have a tendency to reduce insurer profits or, in a competitive market, increase insurance prices. But these payments also reduce the "lapse risk" otherwise associated with purchase of an insurance policy.
[more]

Contributed by: Seth J. Chandler (December 2009)
Open content licensed under CC BY-NC-SA
Snapshots
Details
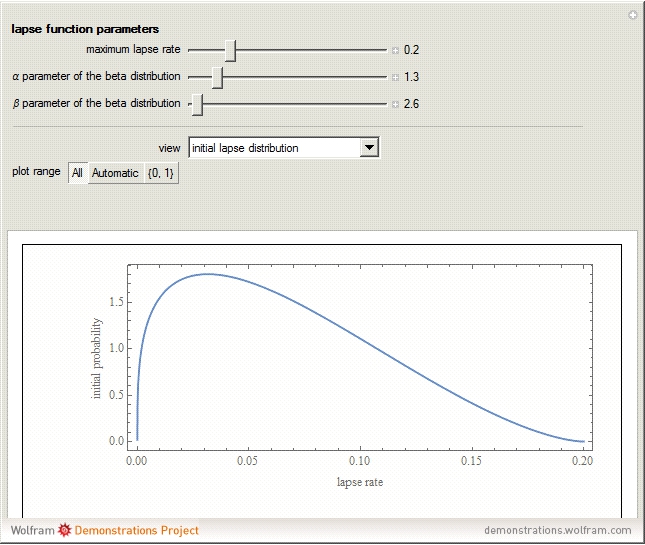
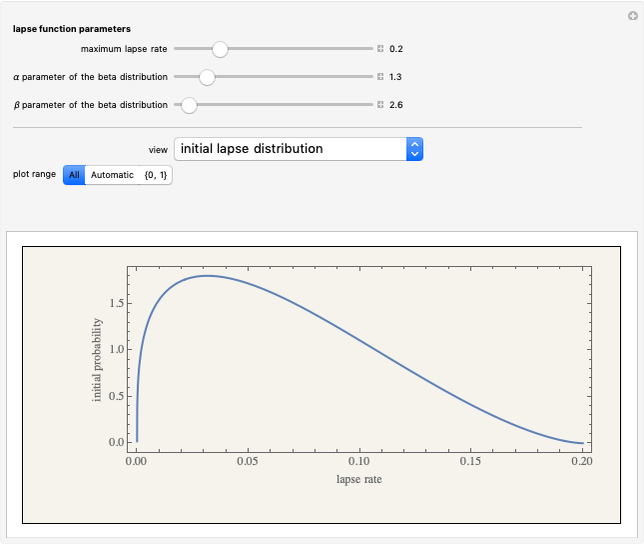
Persistency in this model turns out to be elegantly representable as a Kummer confluent hypergeometric function in which the arguments are functions of the parameters  (the maximum lapse rate) and
  and
and  , which shape the beta distribution of vulnerability levels, as well as the time since the inception of the policy. Mean lapse values and mean vulnerability values are multiples of a regularized Kummer confluent hypergeometric function in which the specific multiples are functions of the parameters , , and .
The published empirical data on the relationship between policy maturity and lapse rates on various forms of insurance appears quite thin. The most comprehensive data found by the author comes from the Financial Services Authority of the United Kingdom, which annually publishes data on "persistency". Some more information is "Lapse Experience Under Lapse-Supported Policies," Canadian Institute of Actuaries, October 1999 and "Lapse Experience Under Universal Life Level Cost of Insurance Policies," Canadian Institute of Actuaries, June 2003. The British Financial Services Authority has also published the "2007 Survey of the Persistency of Life and Pensions policies", which contains information on the persistence (failure to lapse) of whole life insurance policies. The data is not yet sufficient to determine the extent to which this this relatively simple mathematical model accounts for real world behavior.
In "Initial Lapse Distribution" view, there is a control that lets you adjust the vertical plot range.
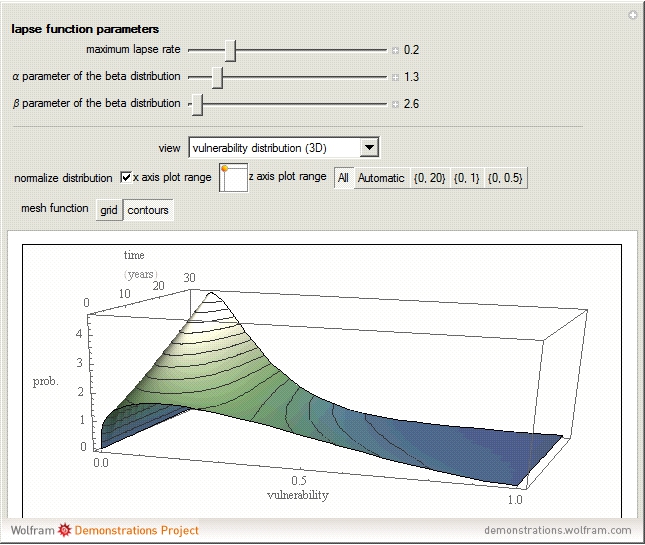
In "Vulnerability Distribution (3D)" view there are four special controls. (1) A checkbox lets you normalize the plot so that the integral over the  axis is always one. The plot thus becomes the probability density function of vulnerability over time. (2) A two-dimensional slider lets you choose the values of the axis variable (vulnerability) for which you want to computations done. The vertical dimension of the slider selects the highest value of vulnerability, while the horizontal dimension of the slider selects the lowest value of vulnerability as a multiple of the highest value. (3) You can set the
  axis plot range from among several choices. (4) You can set whether the grids on the surface show constant axis and
  axis values (grid) or whether they show constant axis values (contour).
In "Vulnerability Distribution (Contours)" view the first two controls from "Vulnerability Distribution (3D)" view are available.
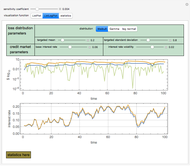
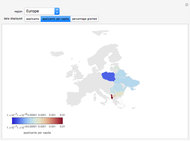
In "Persistency Over Time" and "Mean Lapse Rate Over Time" views, you choose whether to overlay any real world data using a checkbox. If you choose to overlay data, you then select the set of data to overlay. You choose the type of policy sold, the character of the seller and the year in which the policy was issued. The Demonstration then goes to its database of statistics compiled by the United Kingdom's Financial Services Authority and overlays the results onto your graphic. It appears that persistence in the real world varies significantly depending on these three characteristics, suggesting that the lapse benefits offered under the policy, the market being served, and economic conditions affect lapse rates and persistency.
Permanent Citation
 A Conceptual Model of Lapse Financed Life Insurance
Seth J. Chandler Life Insurance Pricing
Seth J. Chandler Insurance Disclosures
Seth J. Chandler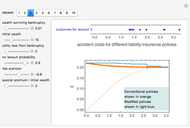 Efficient Single Limit Liability Insurance
Seth J. Chandler Coordination of Insurance Policies
Seth J. Chandler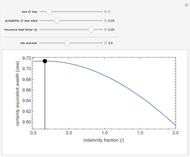 Risk Aversion, Load, and Optimal Insurance
Seth J. Chandler Individual Insurance Decisions under HR 3560 and HR 3962
Seth J. Chandler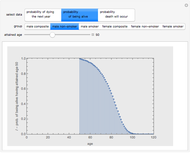 The 2001 CSO Mortality Tables
Seth J. Chandler Adverse Selection
Seth J. Chandler Reinsurance Cut-Through
Seth J. Chandler
-
 Post-Event Bonding
Seth J. Chandler -
 Emulating Land Use Evolution with a Cellular Automaton
Seth J. Chandler -
 General Assembly Resolution Viewer
Seth J. Chandler -
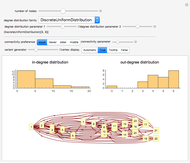 Random Acyclic Networks
Seth J. Chandler -
 A Theory of Insurance Lapses
Seth J. Chandler -
 Asylum in the United States
Seth J. Chandler -
 Property Coinsurance
Seth J. Chandler -
 The Persuasion Effect: A Traditional Two-Stage Jury Model
Seth J. Chandler -
 Cellular Automata with Global Control
Seth J. Chandler -
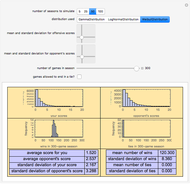 Sports Seasons Based on Score Distributions
Seth J. Chandler -
 Evidentiary Uncertainty
Seth J. Chandler -
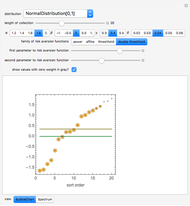 Spectral Measures
Seth J. Chandler -
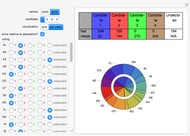 The Banzhaf Power Index of States for Presidential Candidates
Seth J. Chandler -
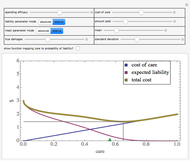
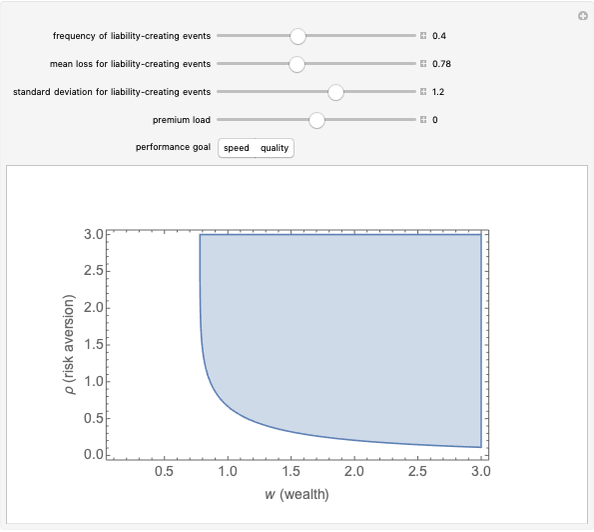 Liability Insurance Desirability under Lognormal Loss Distributions
Seth J. Chandler -
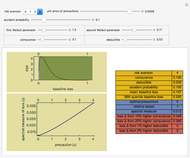 The Effects of Coinsurance and Deductibles on Optimal Precautions for Weibull-Distributed Loss
Seth J. Chandler -
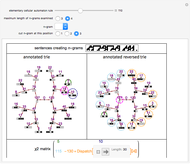 Collocation by Chi Square
Seth J. Chandler -
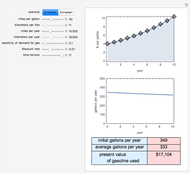 The Present Value of Future Gas Use
Seth J. Chandler -
 Visualizing Legal Rules: A Homicide Case
Seth J. Chandler -
 Communities of Nations Bridged by Language Similarity
Seth J. Chandler