Analysis of Diagnostic Accuracy Measures for Two Combined Diagnostic Tests

Requires a Wolfram Notebook System
Interact on desktop, mobile and cloud with the free Wolfram Player or other Wolfram Language products.
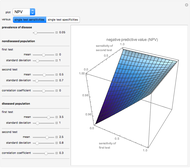
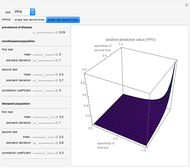
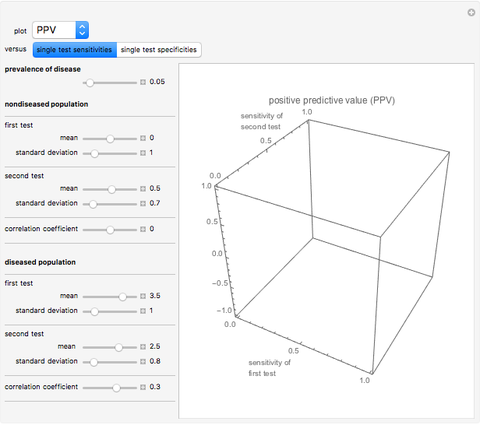
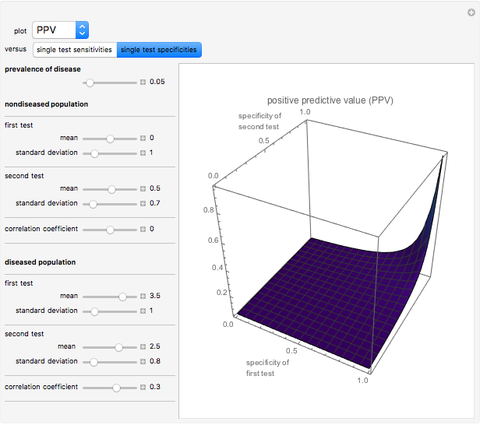
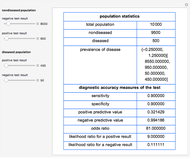
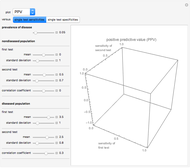
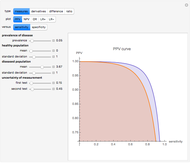
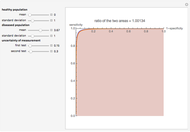
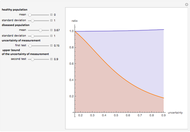
This Demonstration shows plots of various accuracy measures for two combined diagnostic tests applied at a single point in time on nondiseased and diseased populations. This is done for differing prevalence of the disease, taking into account the mean and standard deviations of the populations and the respective correlation coefficients. The mean and standard deviations are expressed in arbitrary units. You can select the following measures of the combined tests using the "plot" popup menu:
[more]
Contributed by: Theodora Chatzimichail and Aristides T. Hatjimihail (Aristeidis T. Chatzimichail) (April 2018)
(Hellenic Complex Systems Laboratory)
Open content licensed under CC BY-NC-SA
Snapshots


Details
Assume bivariate normal distributions for the paired measurements for each of the two tests on both nondiseased and diseased populations. The measures are used in evaluation of the clinical diagnostic accuracy of the combined diagnostic tests applied to a diseased or nondiseased population. They can be calculated as functions of the sensitivities or the specificities of each of the two tests.
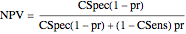
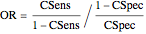
Sensitivity of each single test is the fraction of the diseased population with a positive test result, while specificity is the fraction of the nondiseased population with a negative test result. Sensitivity of the two combined tests is the fraction of the diseased population with at least one positive test result, while specificity is the fraction of the nondiseased population with negative results for both tests. If we denote by  and
and  the sensitivity and the specificity of the combined tests, and by
  the prevalence of the disease, we have:
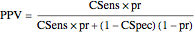 ,
,
 ,
,
 ,
,
 ,
,
 .
.
This Demonstration is an extension of [1] and is appropriate as an educational tool for medical students and junior doctors.
Reference
[1] T. Chatzimichail. "Analysis of Diagnostic Accuracy Measures" from the Wolfram Demonstrations Project—A Wolfram Web Resource. demonstrations.wolfram.com/AnalysisOfDiagnosticAccuracyMeasures.
Permanent Citation
 Calculator for Diagnostic Accuracy Measures
Theodora Chatzimichail Correlation of Positive and Negative Predictive Values of Diagnostic Tests
Theodora Chatzimichail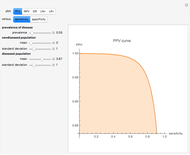 Analysis of Diagnostic Accuracy Measures
Theodora Chatzimichail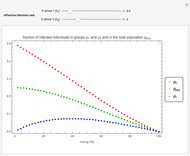 Mixing and Infection in a Two-Group SIS Model
Segismundo S. Izquierdo, Luis R. Izquierdo and Dunia López-Pintado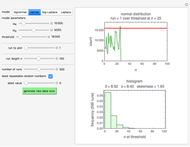 Estimation of Time to Excessive Microbial Count
Mark D. Normand and Micha Peleg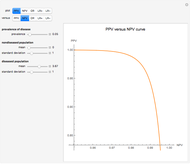 Relation of Diagnostic Accuracy Measures
Theodora Chatzimichail and Aristides T. Hatjimihail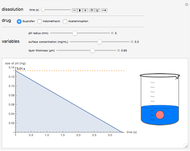 Dissolution of Common Medications as Modeled by Drug Release Kinetics
Megan Mitchell and John Yoon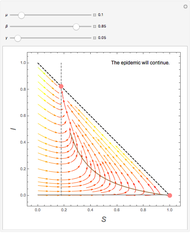 Dynamics of an Epidemic
Marcin Choi?ski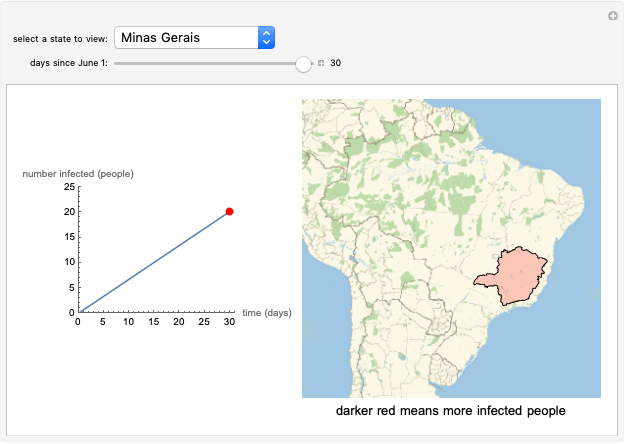 Spread of Zika in Brazil Using the Ross-MacDonald Model
Jessica Lu and John Kwak Processing a Neurological Multiunit-Activity Signal
Subashini Lakshmanan
-
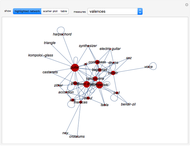 Network of Musical Instruments for Rhythm Accompaniment
Aristides T Hatjimihail -
Relation of Diagnostic Accuracy Measures
Aristides T Hatjimihail -
 Analysis of Diagnostic Accuracy Measures for Two Combined Diagnostic Tests
Aristides T Hatjimihail -
 Uncertainty of Measurement and Diagnostic Accuracy Measures
Aristides T Hatjimihail -
 Receiver Operating Characteristic Curves and Uncertainty of Measurement
Aristides T Hatjimihail -
 Tool for Quality Control Design and Evaluation
Aristides T Hatjimihail -
Analysis of Diagnostic Accuracy Measures
Aristides T Hatjimihail -
 Uncertainty of Measurement and Areas Over and Under the ROC Curves
Aristides T Hatjimihail