Customer Profitability with the Whale Curve


Requires a Wolfram Notebook System
Interact on desktop, mobile and cloud with the free Wolfram Player or other Wolfram Language products.
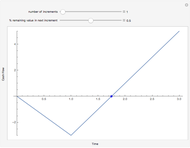
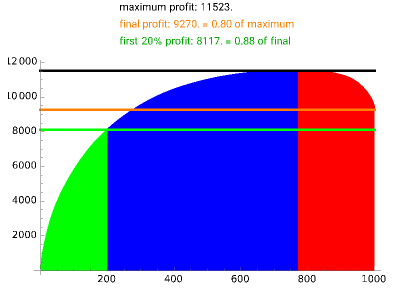
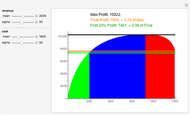
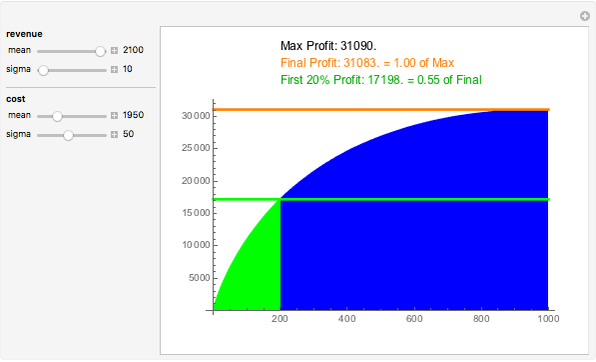
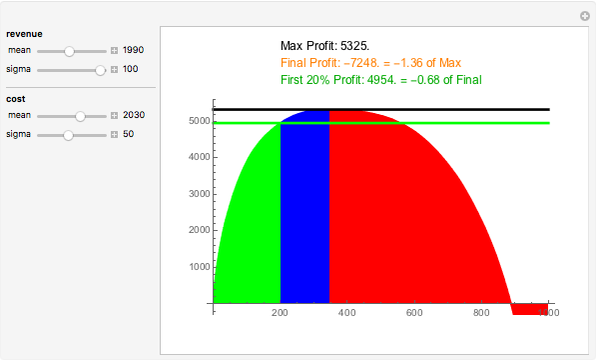
Assume 1000 customers purchased various amounts of products from a business. Cost to serve and revenue from sales vary per customer based on normal distributions controlled by mean and sigma. Each customer contributes an incremental amount of profit equal to the difference of revenue and cost. The whale curve shows cumulative profit sorted by most profitable customer first.
[more]
Contributed by: Thomas Laussermair (July 2011)
After work by: Hans-Gerlach Woudboer
Open content licensed under CC BY-NC-SA
Snapshots


Details
detailSectionParagraphPermanent Citation
"Customer Profitability with the Whale Curve"
http://demonstrations.wolfram.com/CustomerProfitabilityWithTheWhaleCurve/
Wolfram Demonstrations Project
Published: July 7 2011
 Monopoly Profit-Maximization with Quadratic Marginal Cost
Thomas Mitchell Profit Maximization in Perfect Competition
Fiona Maclachlan Dynamic Profit Maximization for a Monopolist
Christos Papahristodoulou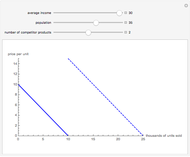 Shifts in the Demand Curve
Sarah Lichtblau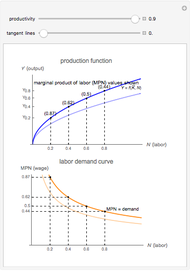 Deriving the Labor Demand Curve
Nicholas Palmer Deriving the Liquidity Preference-Money Supply (LM) Curve
Nicholas Palmer Short-Run Cost Curves
William J. Polley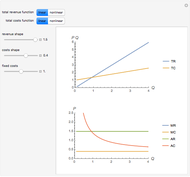 Revenue and Costs Curves Analysis
Timur Gareev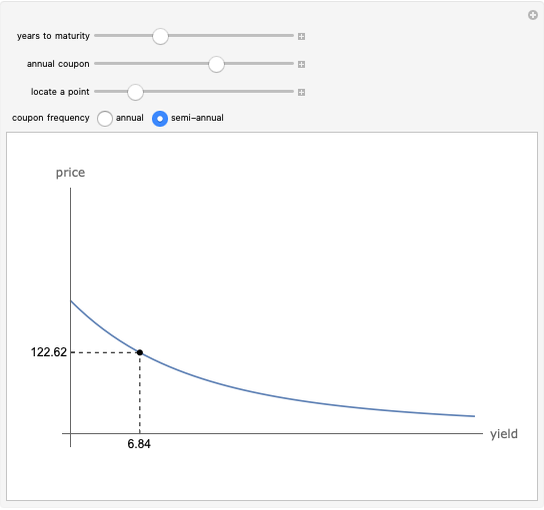 Price-Yield Curve
Fiona Maclachlan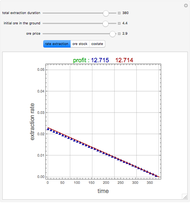 Maximizing Profit in Ore Mining
Housam Binous and Ahmed Bellagi