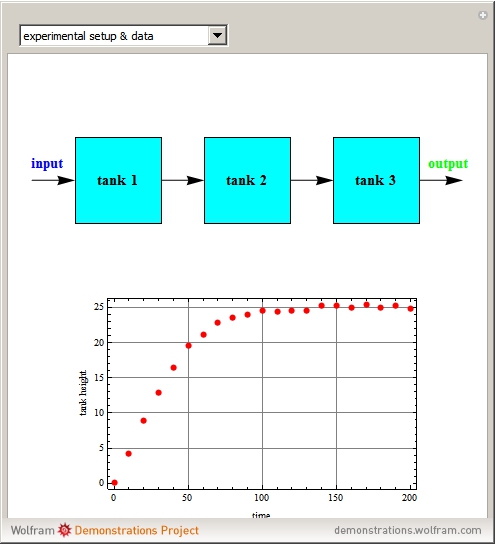
Dynamic Behavior of Three Tanks in Series
Initializing live version

Requires a Wolfram Notebook System
Interact on desktop, mobile and cloud with the free Wolfram Player or other Wolfram Language products.
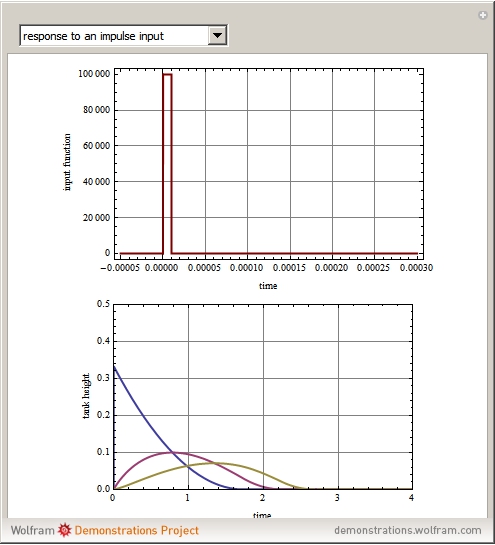
Consider three identical tanks in a series subject to an input function  . The heights of the liquid in the three tanks (i.e.
  ,
,  ,
,  ) obey the following equations:


Contributed by: Housam Binous, Brian G. Higgins, and Ahmed Bellagi (March 2011)
Open content licensed under CC BY-NC-SA
Snapshots
Details
Permanent Citation
Related Demonstrations
More by Author
 Dynamic Behavior of Heated Tanks in Series
Housam Binous and Ahmed Bellagi Flow from a Tank at Constant Height
Mark D. Normand, Maria G. Corradini, and Micha Peleg Dynamic Behavior of a Heated Stirred Tank
Housam Binous Dynamic Behavior of a Bioreactor
Housam Binous Dynamic Behavior of Isothermal Flash Vessel
Housam Binous and Ahmed Bellagi Dynamic Behavior of a Nonisothermal Chemical System
Housam Binous and Zakia Nasri Dynamic Behavior of an Addition Polymerization in a Batch Reactor
Housam Binous and Ahmed Bellagi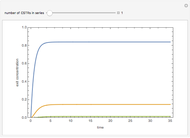 Transient Behavior of N CSTRs in Series with Chemical Reaction
Housam Binous and Ahmed Bellagi Impulse Response of Two and Three Continuous Stirred-Tank Reactors in Series: Exact and Approximate Solutions
Housam Binous, Naim Faqir, Eid Al-Mutairi, and Brian G. Higgins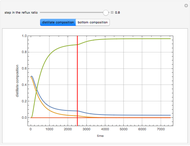 Dynamic Behavior of a Reactive Distillation Column Subject to a Reflux Ratio Step
Housam Binous, Selmi Manel, Ines Wada, and Ahmed Bellagi
-
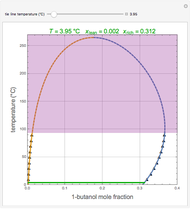 Liquid-Liquid Equilibrium for the 1-Butanol-Water System
Ahmed Bellagi -
 Temperature Dependence of Dehydrogenation of Ethyl Benzene to Styrene
Ahmed Bellagi -
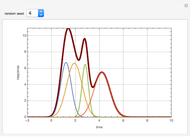 Deconvolution of a Chromatogram
Ahmed Bellagi -
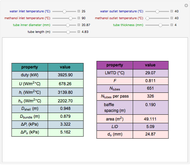 Design of a Shell and Tube Heat Exchanger
Ahmed Bellagi -
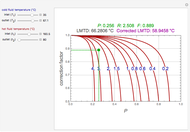 Correction Factor for Shell and Tube Heat Exchanger
Ahmed Bellagi -
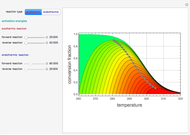 Contour Plots for Reaction Rates
Ahmed Bellagi -
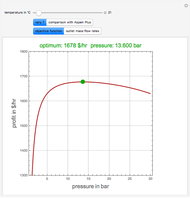 Optimal Conditions for CO2/n-Hexane Flash Separation
Ahmed Bellagi -
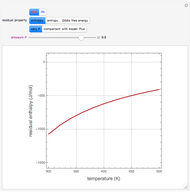 Residual Functions for the SRK and PR Equations of State
Ahmed Bellagi -
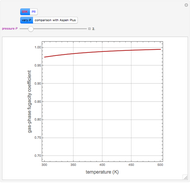 Gas-Phase Fugacity Coefficients for Propylene
Ahmed Bellagi -
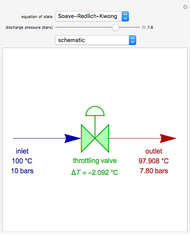 Operation of a Throttling Valve
Ahmed Bellagi -
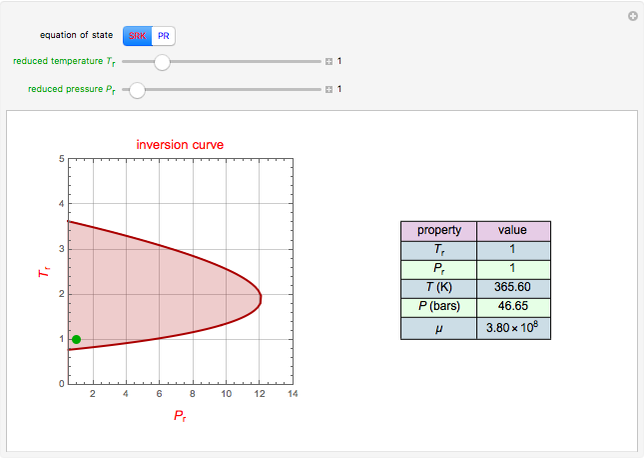 Joule-Thomson Inversion Curves for Soave-Redlich-Kwong (SRK) and Peng-Robinson (PR) Equations of State
Ahmed Bellagi -
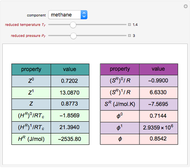 Lee-Kesler Generalized Correlations for Gases
Ahmed Bellagi -
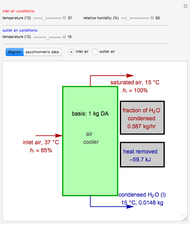 Operation of an Air Conditioner
Ahmed Bellagi -
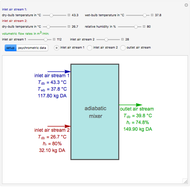 Adiabatic Mixing of Two Moist Air Streams
Ahmed Bellagi -
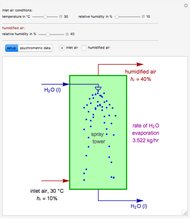 Adiabatic Humidification
Ahmed Bellagi -
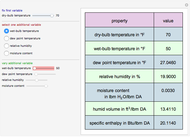 Psychrometric Data Calculator in English Engineering Units
Ahmed Bellagi -
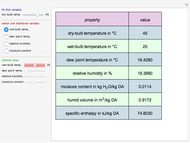 Psychrometric Data Calculator in SI Units
Ahmed Bellagi -
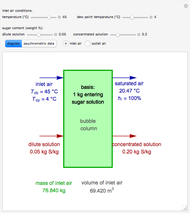 Concentration of Sugar Solution in a Bubble Column
Ahmed Bellagi -
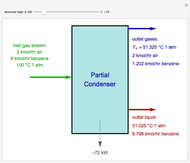 Operation of a Partial Condenser
Ahmed Bellagi -
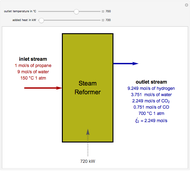 Steam Reforming of Propane
Ahmed Bellagi