Dynamic Electricity Prices

Requires a Wolfram Notebook System
Interact on desktop, mobile and cloud with the free Wolfram Player or other Wolfram Language products.
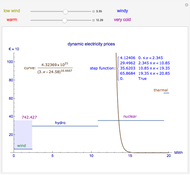
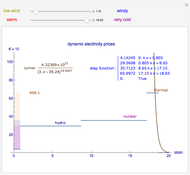
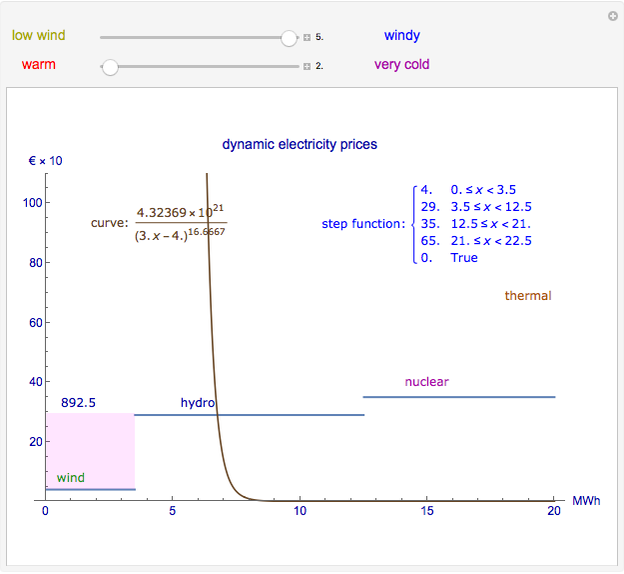
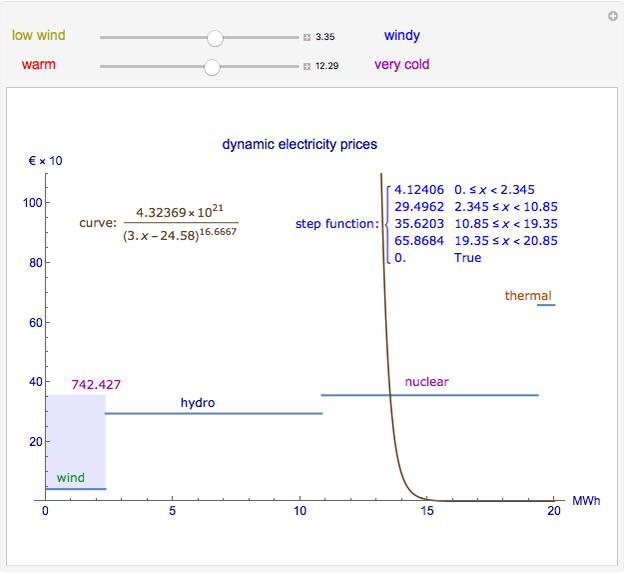
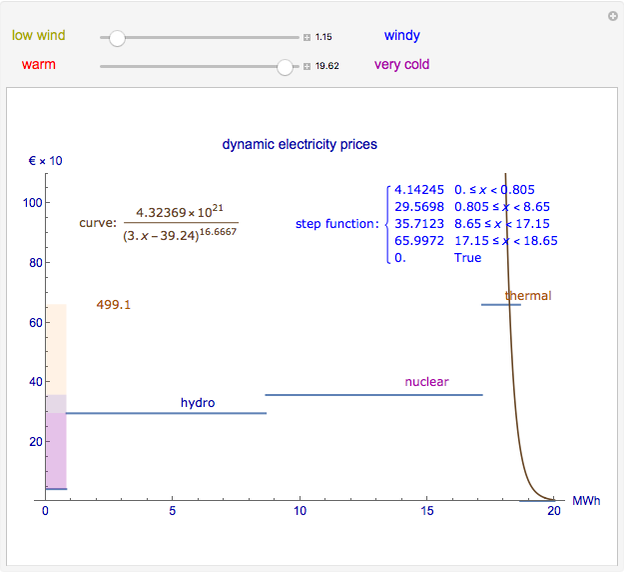
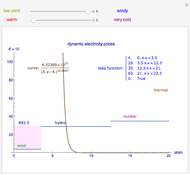
The introduction of wind power in many countries over recent years can influence electricity prices, as well as electricity generation by other high-marginal-cost plants. The generation of wind power has very low marginal costs and is very flexible, due to strong/low winds. In addition to wind power, this Demonstration shows three more plants—hydro, nuclear and thermal—with higher marginal costs and fixed capacities. Wind makes the piecewise electricity supply function (blue) flexible. The electricity demand (brown) has a very low price elasticity and shifts due to low/high temperatures. Consequently, electricity prices are dynamic. The Demonstration shows the optimal loads as well as the dynamic producer surplus of wind power at all equilibria.
Contributed by: Christos Papahristodoulou (September 2019)
(Mälardalen University, Sweden)
Open content licensed under CC BY-NC-SA
Details
In Sweden, almost all electricity is produced by non-fossil sources. The installed capacity is about 150 TW. Hydro and nuclear production are almost equal and they account for about 80%. Wind power has increased over recent years and has reached about 12%. The remaining 8% is generated by thermal and biofuels, while solar plants produce less than 0.5%.
In this Demonstration, the merit order of the sources (according to their marginal cost) is: wind, hydro, nuclear and thermal. The respective marginal costs (\[Euro]/MWh) are 41.4, 29.5, 35.7 and 66, based on various studies. Notice that wind power generation is very stochastic and varies between 5% and 95% of the installed capacity. For instance, in 2018, the average wind power generation was around 27% of its installed capacity, or it operated at full capacity for about 2300 hrs. Obviously, wind power influences the entire supply curve. The demand function is almost vertical (the price elasticity for that function is about -0.024, irrespective of if the electricity price falls to the hydro marginal cost or the thermal marginal cost), in accordance with estimates from various studies.
The key parameter that shifts the demand function in this Demonstration is the temperature. Electricity prices in Sweden have been rather volatile. For instance, in December 2010, the price was about 1000 \[Euro]/MWh, while in May 2011, it was less than 400 \[Euro]/MWh. In 2018, mainly due to a warm winter, the volatility decreased and the price fluctuated around 400 \[Euro]/MWh.
Snapshot 1: This is a typical equilibrium that occurs in spring or early fall in Sweden, when the temperature is comfortable, with some wind. The electricity price is \[Euro]357/MWh. The wind power plants generate about 67% of their installed capacity, yielding a producers' surplus of \[Euro]742. In this case, the marginal generation is produced by the nuclear plants, which is about 30% of their installed capacity.
Snapshot 2: This is a typical equilibrium that occurs in winter in Sweden, with very low temperatures and rather weak wind. The electricity price is \[Euro]660/MWh with thermal being the marginal plant. The wind power plants generate about 23% of their installed capacity, yielding a producers' surplus of almost \[Euro]500. The other two sources, hydro and nuclear, operate at their full capacity.
References
[1] N. Lundberg, "An Econometric Analysis of the Electricity Price." www.diva-portal.org/smash/get/diva2:1115970/FULLTEXT01.pdf.
[2] Swedish Energy Agency. "Energy in Sweden: Facts and Figures 2018." www.energimyndigheten.se/en/news/2018/energy-in-sweden---facts-and-figures-2018-available-now.
[3] Wikipedia. "Electricity Sector in Sweden." (Sep 16, 2019) en.wikipedia.org/wiki/Electricity_sector_in _Sweden.
[4] D. M. Bain and T. L. Acker, "Hydropower Impacts on Electrical System Production Costs in the Southwest United States." www.researchgate.net/publication/322933989_Hydropower _Impacts _on _Electrical _System _Production _Costs _in _the _Southwest _United _States.
[5] World Nuclear Association. "Economics of Nuclear Power." (Sep 16, 2019) www.world-nuclear.org/information-library/economic-aspects/economics-of-nuclear-power.aspx.
Snapshots

Permanent Citation
 Tuned Mass Damper
Nabil Fares Electrical Power Utilization over Time
Christos Papahristodoulou Forces on a Completely Submerged Gate
Rachael L. Baumann Electric Current
Enrique Zeleny Reading Electric Meters
Enrique Zeleny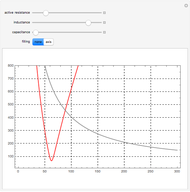 Electrical Impedance of Biological Tissues
Olexandr Eugene Prokopchenko Three-Branch Electrical Circuit
Darya Aleinikava Electric and Magnetic Fields near a Transmission Line
Y. Shibuya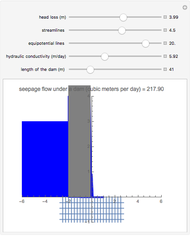 Seepage under a Dam by Flow Nets
Leili Gordji and Sam Gordji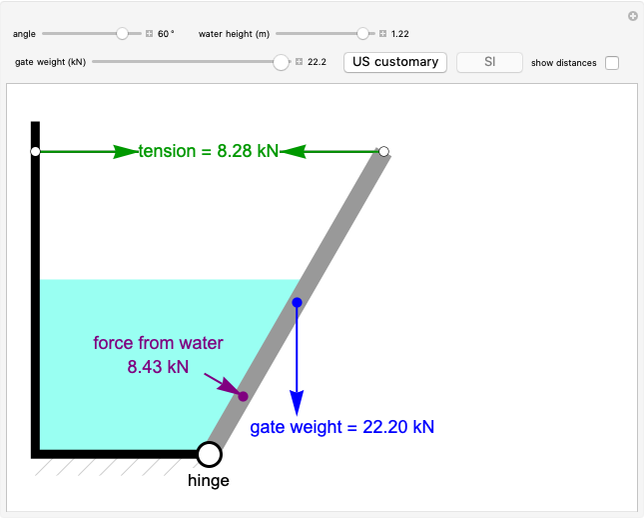 Forces on a Partially Submerged Gate
Rachael L. Baumann
-
 Dynamic Electricity Prices
Christos Papahristodoulou -
Electrical Power Utilization over Time
Christos Papahristodoulou -
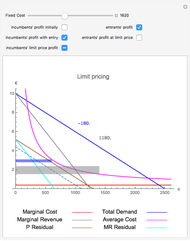 Limit Pricing
Christos Papahristodoulou -
 Monopolistic Competition with a Homogeneous Product
Christos Papahristodoulou -
 Imperfect Cartel
Christos Papahristodoulou -
 Dynamic Profit Maximization for a Monopolist
Christos Papahristodoulou