Dynamic Model of Pandemic Influenza with Age Structure and Vaccination


Requires a Wolfram Notebook System
Interact on desktop, mobile and cloud with the free Wolfram Player or other Wolfram Language products.
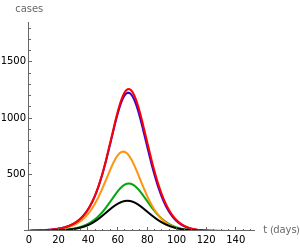
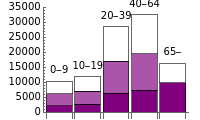
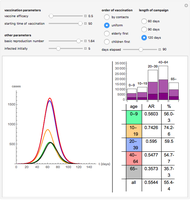
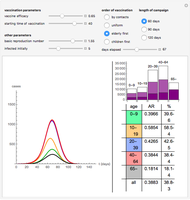
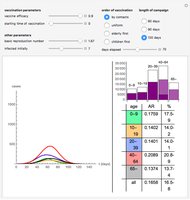
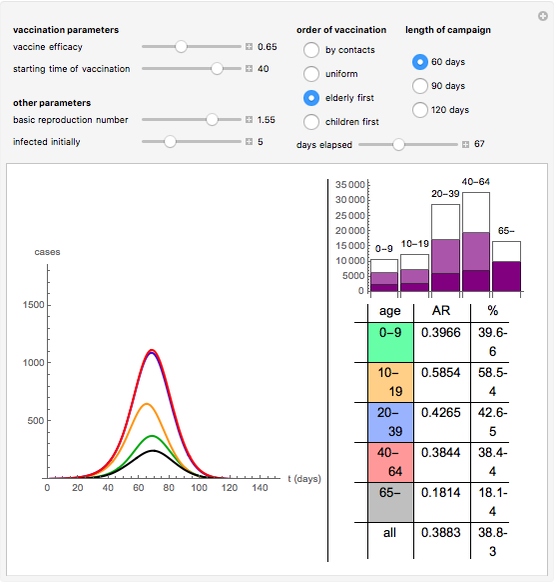
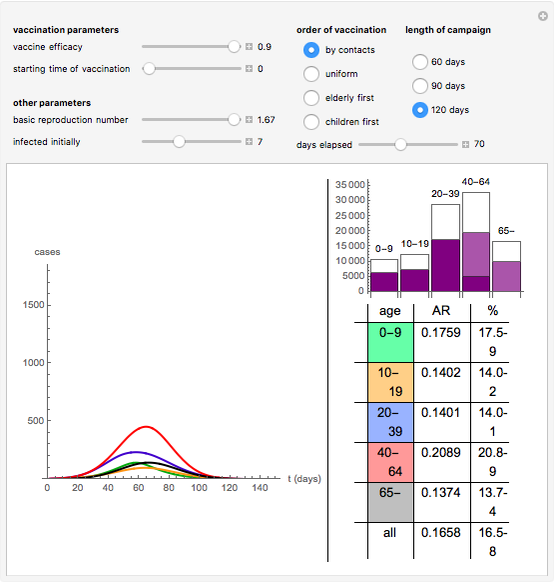
This Demonstration presents a 50-dimensional nonautonomous compartmental SEIR-based model with age structure to study the effect of age-specific scheduling of vaccination during a pandemic influenza outbreak, specifically when there is a race between the vaccination campaign and the dynamics of the pandemic. (SEIR stands for Susceptible, Exposed (but not infectious), Infectious, and Recovered.) We compare four different scheduling strategies and target a 60% vaccination coverage in each age group using all of the strategies. You can use the "days elapsed" slider to follow the vaccination order of the age groups and the vaccination state on the bar chart. The morbidity curves of the five age groups (the total population size is 100,000) are depicted on the left chart and change as you modify the epidemiological parameters. The attack rate (AR) of an age group is the fraction of the age group that contracts the infection during the course of the outbreak. The reproduction number is the key concept of an epidemic, as it determines the average number of infections generated by a single infected individual introduced into a wholly susceptible population.
Contributed by: Diana Hulman-Knipl, Adam Hulman
Additional contribution by: Janos Karsai, Gergely Rost (October 2011)
(University of Szeged, Hungary)
Open content licensed under CC BY-NC-SA
Snapshots

Details
The four vaccination strategies differ in the timing of vaccination for various age groups:
(1) by contacts: The age groups for vaccination are taken in decreasing order of their total contact numbers. (2) uniform: The vaccination of the five age groups is run in parallel for the five age groups. (3) elderly priority: The most elderly age group is vaccinated first, then the other four in parallel. (4) children priority: The two youngest age groups are vaccinated first, then the other three in parallel.
The infection rates between various age groups were derived from the contact structure of a European survey. The strategies can be contrasted across an important outcome measure: the attack rates (displayed in the bottom-right table). By modifying the parameters and testing the strategies, you can identify some interesting phenomena. For instance, when the vaccination starts within 30 days, the "by contacts" strategy will result in a lower attack rate for the elderly than the strategy that prioritizes this very age group. This example supports the assumption that prioritizing particular age groups can be a benefit for other age groups as well. The Demonstration is based on the simplified version of the model from [1].
Reference
[1] D. H. Knipl and G. Rost, "Modelling the Strategies for Age Specific Vaccination Scheduling During Influenza Pandemic Outbreaks," Mathematical Biosciences and Engineering, 8(1), 2011 pp. 123–139.
 Vaccinations and Herd Immunity Using the SIR Disease Epidemic Model
Tara Nenninger and Soumyaa Mazumder A Model of Plasmodium Falciparum Population Dynamics in a Patient during Treatment with Artesunate
Sompob Saralamba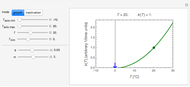 Square Root Model for Rates of Microbial Growth or Inactivation
Mark D. Normand and Micha Peleg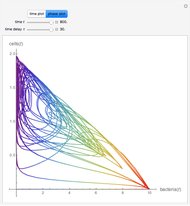 Chaos Induced by Delay in Model of the Immune Response
Clay Gruesbeck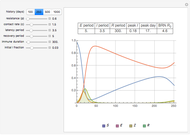 Reed-Frost SEIR Model
David Gurarie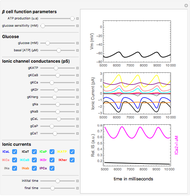 Model of Electrical Activity in Human Pancreatic Beta Cells
Gerardo J. Felix-Martinez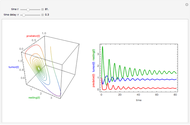 Chaos in Tumor Growth Model with Time-Delayed Immune Response
Clay Gruesbeck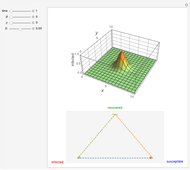 Spatio-Temporal Epidemic Spread
Jan Baetens Lag Time in Microbial Growth
Mark D. Normand and Micha Peleg Degrees of Microbial Injury and Survival
Mark D. Normand and Micha Peleg
