Expanded Magnitude Estimation Method


Requires a Wolfram Notebook System
Interact on desktop, mobile and cloud with the free Wolfram Player or other Wolfram Language products.
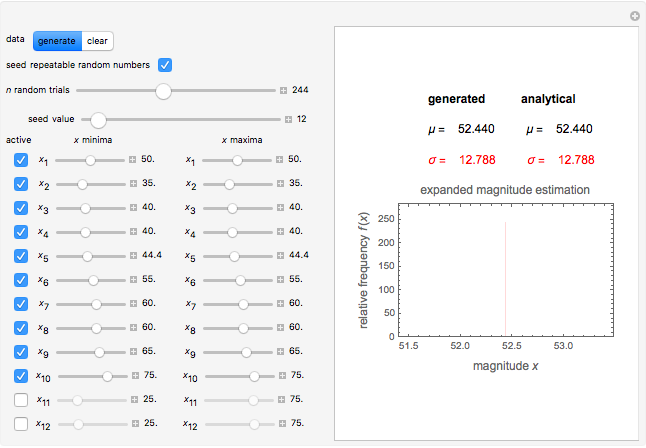
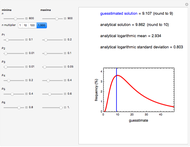
This Demonstration presents an expanded version of the magnitude estimation method used to assess the perceived intensity of physical and chemical stimuli by humans or their preference for a product. It is based on the individual subject or panelist's assessment, not as a single number or equivalent length, but as lower and upper limits of a range. This is followed by Monte Carlo simulations to produce the mean response and its standard deviation. These can also be computed directly from the entered ranges' limits. If the entered minimum equals the entered maximum in all the evaluations, this reduces to the traditional method.
Contributed by: Mark D. Normand and Micha Peleg (September 2011)
Open content licensed under CC BY-NC-SA
Snapshots


Details
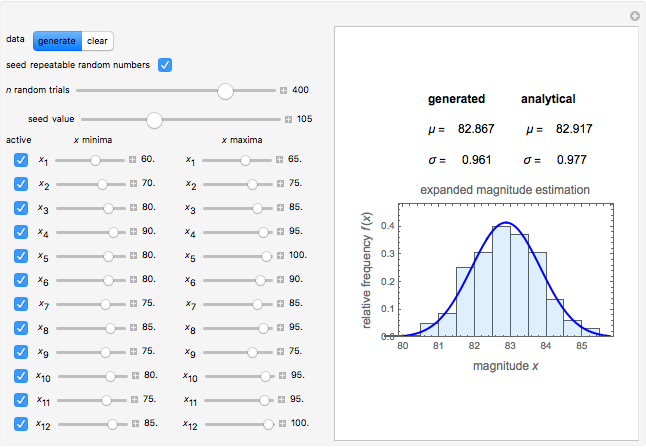
Snapshot 1: twelve relatively high ratings having a relatively small spread
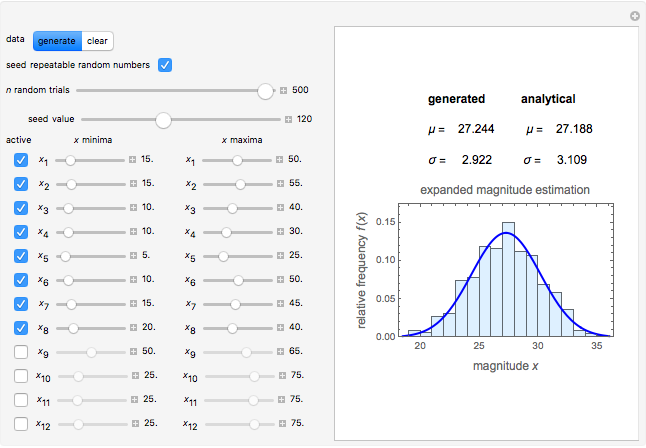
Snapshot 2: eight relatively low ratings having a relatively large spread
Snapshot 3: ten ratings entered as in the traditional method (all the  minima are equal to their corresponding maxima)
This Demonstration simulates an expanded version of the magnitude estimation method, where the sensory evaluations are entered as lower and upper limits of a range rather than single numbers or equivalent lengths. The calculation of the mean and standard deviation of the entered evaluations is done in two ways for mutual verification:
1. By Monte Carlo simulation, generating and averaging of numerous combinations of values chosen randomly from within the respective intervals. The mean  and standard deviation
  of this generated data are considered as those that correspond to the specified ranges.
2. Analytically, using the formulas  and
and  , where
  is the number of evaluations. The term
  is the variance of a continuous uniform distribution with a domain from
  to
to  .
.
The number of Monte Carlo random trials  , the seed value, and the
  and
and  are entered with sliders. The evaluations are activated by clicking a checkbox, as is the use of the entered seed's value. In order to produce new random trials with exactly the same parameter settings, first click the "clear" button and then the "generate" button.
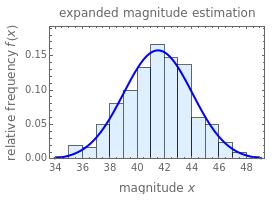
The output includes the mean and standard deviation values calculated by the above two methods, the histogram of the values generated by the Monte Carlo simulations, and a plot of the normal distribution that has the same mean and standard deviation as the generated data.
When all the  are equal to their corresponding , this is equivalent to the traditional magnitude estimation method. The histogram in this case consists of a single bin, and the standard deviation value is to be printed in red.
Permanent Citation
 Failure Probabilities from Quality Control Charts
Mark D. Normand and Micha Peleg Probabilistic Model Showing Sigmoid Semilogarithmic Survival
Mark D. Normand, Micha Peleg, and Zack J. Rosenthal Expanded Fermi Solution for Estimating a Complaint's Probability
Mark D. Normand, Micha Peleg, and Joseph Horowitz Maximum Likelihood Estimation
Marc Brodie (Wheeling Jesuit University) Kernel Density Estimation
Jeff Hamrick Maximum Likelihood Estimation for Coin Tosses
Tad Hogg Maximum Likelihood Estimation of Ordinary and Finite Mixture Distributions
Heikki Ruskeepää and M. A. Ghorbani The Method of Inverse Transforms
Ryan Carroll, Adam Joplin, Jeff Hamrick, and Eric Stradley The Method of Common Random Numbers: An Example
Jeff Hamrick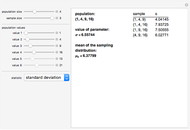 Unbiased and Biased Estimators
Marc Brodie (Wheeling Jesuit University)
-
 Ratkowski's Square Root Growth Rate Model for High Temperatures
Micha Peleg -
 Gordon-Taylor and Fox Equations for Glass Transition Temperature
Micha Peleg -
 Force to Overcome Vacuum Pull
Micha Peleg -
 Extending the Square Root Growth Rate Model to Lethal Low Temperatures
Micha Peleg -
 Probability of Being Strange According to Paulos
Micha Peleg -
 Successive Three-Point Method for Weibullian Chemical Degradation
Micha Peleg -
 Estimating Cohesion and Tensile Strength of Compacted Powders
Micha Peleg -
 Three-Endpoints Method for Isothermal Weibullian Chemical Degradation
Micha Peleg -
 Vitamin C Loss in Foods During Heat Processing and Storage
Micha Peleg -
 Parameterizing Temperature-Viscosity Relations
Micha Peleg -
 Laplace Distribution in Fluctuating Stock Index Records
Micha Peleg -
 Weibullian Chemical Degradation
Micha Peleg -
 Simulating Ascorbic Acid Degradation
Micha Peleg -
 Additive and Multiplicative Risks
Micha Peleg -
 Endpoints Method for Predicting Chemical Degradation in Frozen Foods
Micha Peleg -
 Exponential Model for Arrhenius Activation Energy
Micha Peleg -
 Prediction of Isothermal Degradation by the Endpoints Method
Micha Peleg -
 Risk Guesstimation from Factor Ranges
Micha Peleg -
 Volatiles Formation Kinetics in Stored Fish
Micha Peleg -
 Comparison of Six Sigmoid Growth Curve Models
Micha Peleg