Graphical Linear Programming for Two Variables

Requires a Wolfram Notebook System
Interact on desktop, mobile and cloud with the free Wolfram Player or other Wolfram Language products.
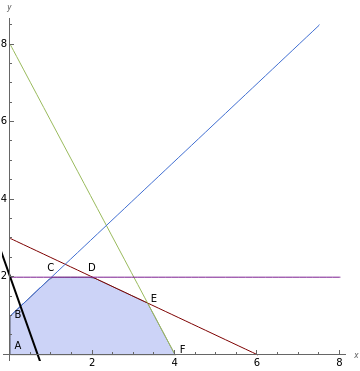
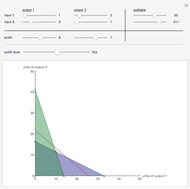
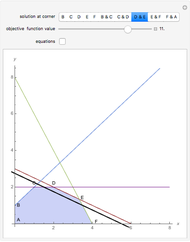
This Demonstration illustrates the graphical solution to several linear programming problems, all of which have the same set of constraints; you can vary the objective function. When two corner points are optimal, so are all the points on the line segment connecting them. The region shaded in blue is the feasible region and the colored lines correspond to the constraints. The black line represents the chosen objective function set to the slider value.
Contributed by: Olivia M. Carducci (East Stroudsburg University) (March 2011)
Open content licensed under CC BY-NC-SA
Snapshots
Details
In this Demonstration, it is not possible to choose an objective function that makes  optimal because such an objective function would either involve a minimization problem or a maximization problem with negative coefficients for
  and
and  . Such problems would require different values for the right hand side and so do not fit well with the slider. You cannot make
  and
and  optimal because such an objective function would be a vertical line.
Permanent Citation
"Graphical Linear Programming for Two Variables"
http://demonstrations.wolfram.com/GraphicalLinearProgrammingForTwoVariables/
Wolfram Demonstrations Project
Published: March 7 2011
