Logarithmic Mean Temperature of a Heat Exchanger


Requires a Wolfram Notebook System
Interact on desktop, mobile and cloud with the free Wolfram Player or other Wolfram Language products.
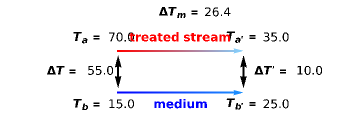
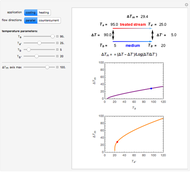
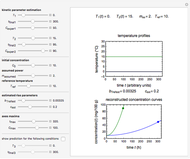
This Demonstration calculates and plots the logarithmic mean temperature of a heat exchanger at different combinations of the entry and exit temperatures of the treated and medium streams (with their directions shown).
Contributed by: Mark D. Normand and Micha Peleg (March 2011)
Open content licensed under CC BY-NC-SA
Snapshots


Details
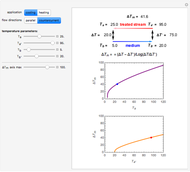
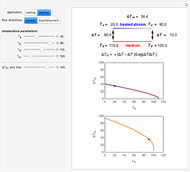
Snapshot 1: parallel cooling from 95 to 25 °C resulting in a logarithmic mean temperature of 29.4 °C
Snapshot 2: countercurrent cooling from 95 to 25 °C resulting in a logarithmic mean temperature of 41.6 °C
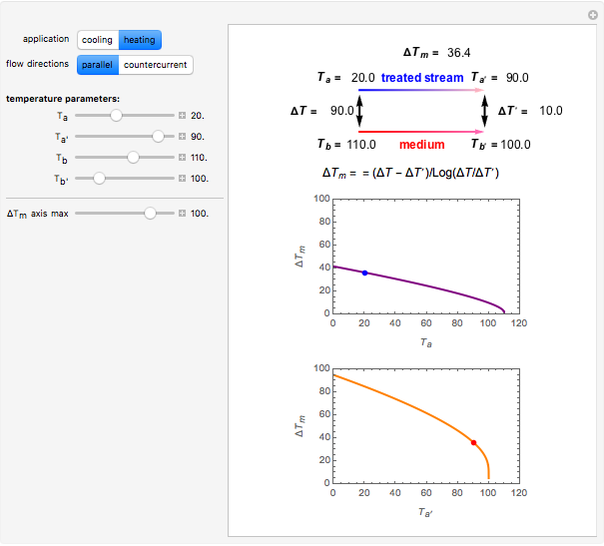
Snapshot 3: parallel heating from 20 to 90 °C resulting in a logarithmic mean temperature of 36.4 °C
Snapshot 4: countercurrent heating from 20 to 90 °C resulting in a logarithmic mean temperature of 43.3 °C
This Demonstration calculates the logarithmic mean temperature,  , of a heat exchanger serving as a heater or cooler in parallel and countercurrent flows. It helps the user to visualize how the streams' directions can affect the heat exchanger's efficiency. is defined as
  , where
  and
and  are the temperature differences between the treated stream's temperature and the medium's temperature at the two ends of the heat exchanger. is always larger in countercurrent flows except when one stream is at a constant temperature, in which case the flow direction does not matter.
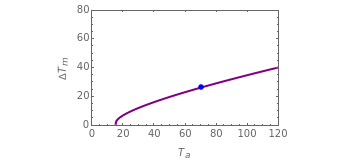
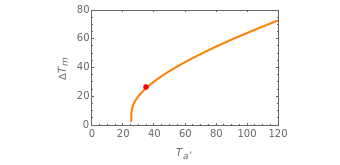
In the diagram depicting the heat exchanger the treated stream is always on top. The Demonstration plots the streams' directions with the corresponding entry and exit temperatures. By clicking a selector switch you can reverse the treated stream's direction to see the effect on . Another selector switch lets you choose between cooling and heating. The Demonstration also displays separate plots of as a function of the entry and exit temperatures of the treated stream. You can also use the sliders to choose the values for the entry and exit temperatures of the two streams,  and
and  and
and  and
and  , as well as the maximum value of the two
 plot axes.
References:
R. L. Earle with M. D. Earle, Unit Operations in Food Processing, NZIFST, Inc., 1983.
C. J. Geankoplis, Transport Processes and Unit Operations, 2nd ed., Boston: Allyn and Bacon, 1983.
Permanent Citation
 Mass Balance in a Single-Stage Evaporator
Mark D. Normand, Maria G. Corradini, and Micha Peleg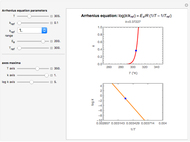 Arrhenius Equations for Reaction Rate and Viscosity
Mark D. Normand, Maria G. Corradini, and Micha Peleg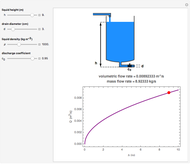 Flow from a Tank at Constant Height
Mark D. Normand, Maria G. Corradini, and Micha Peleg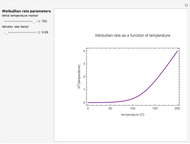 Weibullian Inactivation Rate as a Function of Temperature
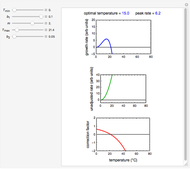
Mark D. Normand and Micha Peleg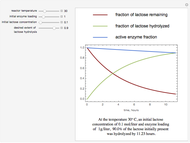 Optimum Temperature for Lactose Hydrolysis in Batch Reactors
David J. W. Simpson and Dhinakar S. Kompala Equivalent Isothermal Time at a Reference Temperature as a Function of Time
Mark D. Normand and Micha Peleg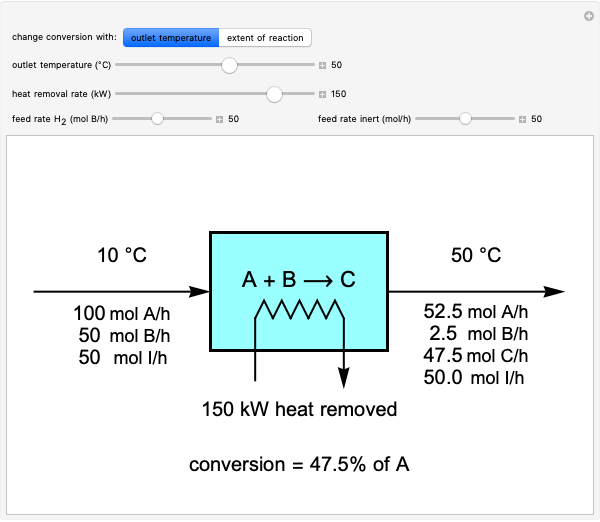 Material and Energy Balances in a Reactor with Heat Exchange
Michael Wrobel and Rachael L. Baumann Log Survival Ratio as a Function of Time
Mark D. Normand and Micha Peleg Weibullian Inactivation Rate as a Function of Time
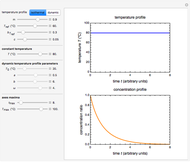
Mark D. Normand and Micha Peleg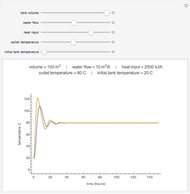 Proportional Temperature Control
Jeff Bryant
-
 Ratkowski's Square Root Growth Rate Model for High Temperatures
Micha Peleg -
 Gordon-Taylor and Fox Equations for Glass Transition Temperature
Micha Peleg -
 Force to Overcome Vacuum Pull
Micha Peleg -
 Extending the Square Root Growth Rate Model to Lethal Low Temperatures
Micha Peleg -
 Probability of Being Strange According to Paulos
Micha Peleg -
 Successive Three-Point Method for Weibullian Chemical Degradation
Micha Peleg -
 Estimating Cohesion and Tensile Strength of Compacted Powders
Micha Peleg -
 Three-Endpoints Method for Isothermal Weibullian Chemical Degradation
Micha Peleg -
 Vitamin C Loss in Foods During Heat Processing and Storage
Micha Peleg -
 Parameterizing Temperature-Viscosity Relations
Micha Peleg -
 Laplace Distribution in Fluctuating Stock Index Records
Micha Peleg -
 Weibullian Chemical Degradation
Micha Peleg -
 Simulating Ascorbic Acid Degradation
Micha Peleg -
 Additive and Multiplicative Risks
Micha Peleg -
 Endpoints Method for Predicting Chemical Degradation in Frozen Foods
Micha Peleg -
 Exponential Model for Arrhenius Activation Energy
Micha Peleg -
 Prediction of Isothermal Degradation by the Endpoints Method
Micha Peleg -
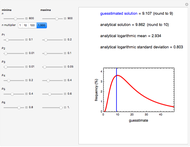 Risk Guesstimation from Factor Ranges
Micha Peleg -
 Volatiles Formation Kinetics in Stored Fish
Micha Peleg -
 Comparison of Six Sigmoid Growth Curve Models
Micha Peleg