Morphing the Graph of a Function to Its Domain


Requires a Wolfram Notebook System
Interact on desktop, mobile and cloud with the free Wolfram Player or other Wolfram Language products.
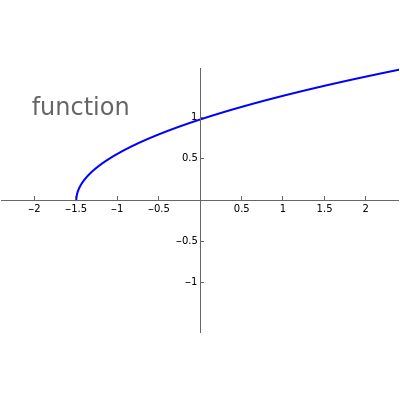
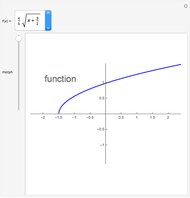
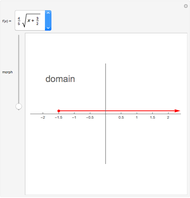
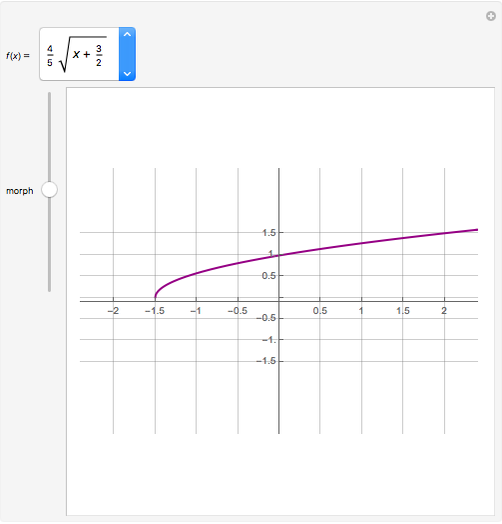
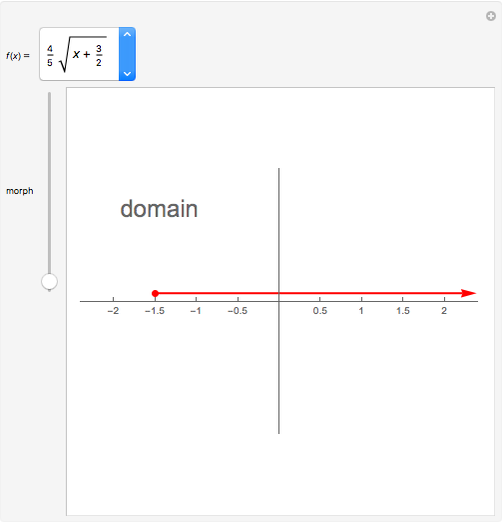
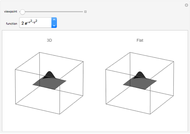
Use the "morph" slider to continuously change the graph of a function (the Plot command in Mathematica) into its domain (the FunctionDomain and NumberLinePlot commands).
Contributed by: José Luis Gómez-Muñoz (August 2015)
Open content licensed under CC BY-NC-SA
Snapshots


Details
detailSectionParagraphPermanent Citation
"Morphing the Graph of a Function to Its Domain"
http://demonstrations.wolfram.com/MorphingTheGraphOfAFunctionToItsDomain/
Wolfram Demonstrations Project
Published: August 17 2015
 Riemann's Example of a Continuous but Nowhere Differentiable Function
Michael Trott Lipschitz Continuity
Bruce Atwood Integral Mean Value Theorem
Chris Boucher Mathematics Subject Classification Graphs
Michael Schreiber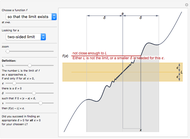 Epsilon-Delta Definition of Limit
Ferenc Beleznay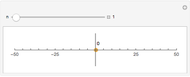 Enumerating the Rationals
Matthew Szudzik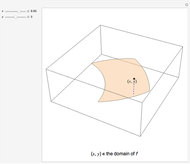 Domain of a Function of Two Variables
Laura R. Lynch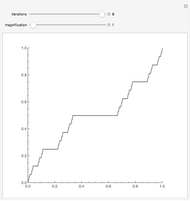 Cantor Function
Douglas Rivers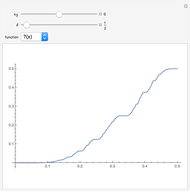 Minkowski's Question Mark Function
Oleksandr Pavlyk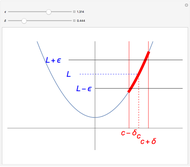 Limit of a Function at a Point
Quinn Morris
-
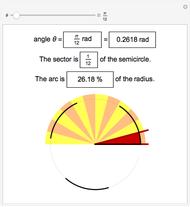 Radians as Percentages
José Luis Gómez Muñoz -
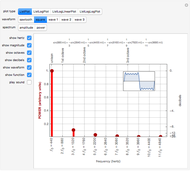 Logarithmic Scales in Acoustic Spectra: Decibels and Octaves
José Luis Gómez Muñoz -
 Morphing the Graph of a Function to Its Domain
José Luis Gómez Muñoz -
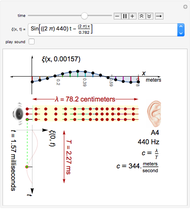
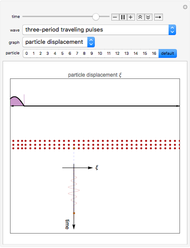 Traveling Longitudinal Pulses and Standing Waves
José Luis Gómez Muñoz -
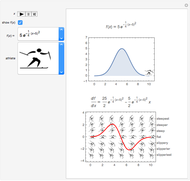 Differentiation for Athletes
José Luis Gómez Muñoz -
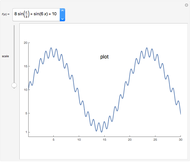 Morphing from Plot to Log Plot
José Luis Gómez Muñoz -
 Properties of Acoustic Plane Waves
José Luis Gómez Muñoz -
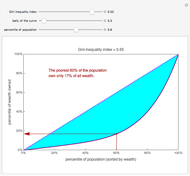 The Lorenz Curve
José Luis Gómez Muñoz -
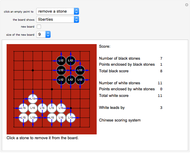 Learn the Game of Go
José Luis Gómez Muñoz -
 Anamorphic 2D Images That Look Three-Dimensional from a Particular Viewpoint
José Luis Gómez Muñoz -
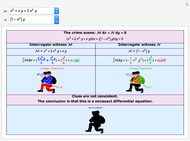 The Murder Mystery Method for Identifying and Solving Exact Differential Equations
José Luis Gómez Muñoz -
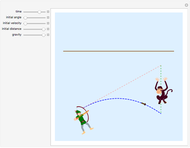 Parabolic Projectile Motion: Shooting a Harmless Tranquilizer Dart at a Falling Monkey
José Luis Gómez Muñoz -
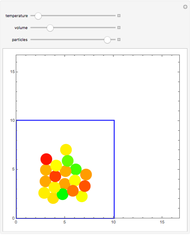 Molecular Dynamics of Lennard-Jones Particles Using the Velocity Verlet Algorithm
José Luis Gómez Muñoz -
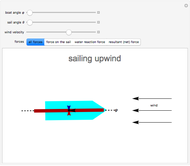 Sailing against the Wind
José Luis Gómez Muñoz